
The overall objective of the Usage and Attitude (U&A) marketing research study is to understand consumer behavior in order to influence it.
The U&A is a flexible marketing research method that enables you to both explore market environments and describe how the market actors behave. AA&U, Awareness Attitude & Usage, is the US acronym of the European name.
As the name suggests, there are two sections in a typical U&A questionnaire:
-
- The usage section asks respondents about how they behave when consuming products or product categories.
- The attitude section asks respondents about their beliefs, opinions, and intentions concerning the object of the survey.
Information collected with Usage & Attitude surveys is often used to support decisions related to the launch of new products and features, as well as to register market characteristics and their mutations over time.
The U&A study requires, in most cases, a semi-structured questionnaire (includes both closed- and open-ended questions) and a large sample representative of the population it comes from.
Among common risks related to this survey method:
-
- Risk of conducting a giant survey, with many questions and without a clear objective
- Long questionnaires are exposed to the risk of collecting invalid answers, due to the loss of attention of respondents, who may not provide well-thought-out answers
- Risk of collecting a lot of non-actionable data
Anatomy of a U&A questionnaire
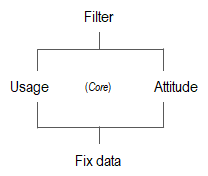
The questionnaire of a U&A study is divided into three parts: Filter questions, core questions, and fix data.
-
- Filter questions. From one to a few questions are typically placed at the beginning of the questionnaire with the objective of identifying respondents with the necessary characteristics to be recruited for the study. For instance, we may need respondents who travelled abroad for pleasure in the past 12 months (one question filter); we may want to recruit women 18-34 years old who purchased red wine last week (two question filter); or any other kind of respondent profile. Filter questions are not always needed.
- Core questions. Intuitively, the core section of a U&A study asks about the usage of objects (products) and the opinions (attitudes) of users about selected attributes of those objects.
- Fix data. At the end of the survey the questionnaire collects respondents’ demographic data. During the data analysis phase, these answers help to draw a multifaceted profile of the survey respondents. For representative studies like the U&A, the demographic characteristics of respondents should always be gathered for quantification and verification purposes (that the sample reproduces the population it was drawn from).
The core U&A logic
The U&A can focus on a single brand (monadic) or it can cover several brands (sequential comparison). In the latter case the researcher must limit the number of brands to include in the study in order to avoid the risk of creating giant questionnaires likely to lose the attention of the respondents.
The logic we suggest is to split respondents into meaningful groups. For instance, a single question like “How often do you use [Brand X] in a typical week?” allows for dividing respondents into Heavy and Light users, or Users and Non-users. Whatever the chosen question, the objective is to create groups of respondents to conduct a deeper analysis of the study results.
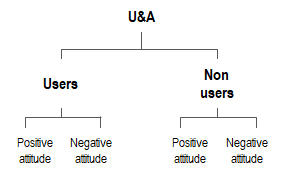
During the analysis phase an additional segmentation could be made between respondents with a Positive or Negative attitude. In so doing, we create four groups of homogeneous respondents.
At this time, it should be clear whether the study is needed for forecasting purposes (inference) or for comparing groups (difference). This decision determines how to recruit respondents. Forecasting needs a representative sample of the population the sample is drawn from, typically a random selection of respondents. Comparison needs groups of equal size, large enough to detect significant differences between groups.
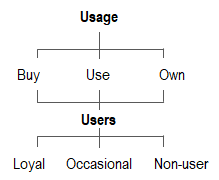
Finally, the (four) groups we create are described in terms of brand usage, which covers three areas: Purchase, use, and possession.
Try LogRatio’s fully automated solution for the professional analysis of survey data.
In just a few clicks LogRatio transforms raw survey data into all the survey tables and charts you need,
including a verbal interpretation of the survey results.
It is worth giving LogRatio a try!
Common investigation areas
The following is a (not exhaustive) list of topics commonly investigated to describe consumers’ use of a product.
The “Why” questions are asked in the Attitude section of the questionnaire. Among common Why-questions asked during Usage & Attitude marketing research studies:
-
- Likes and Dislikes (subjective opinions, typically asked with open-ended questions)
- Reasons for use or non-use
- Brand switch
- Product improvements
- Brand representativeness
Why-questions may require the use of open-ended questions in order to gather top-of-mind answers, although the use of predefined answer options is also common. The advantage of closed-ended questions is that they do not require work-intensive transformations of free text into numerical codes that computers can elaborate (coding). The disadvantage is that respondents’ real reasons why may not be on the list, and we run the risk of missing important pieces of information.
How to investigate Usage
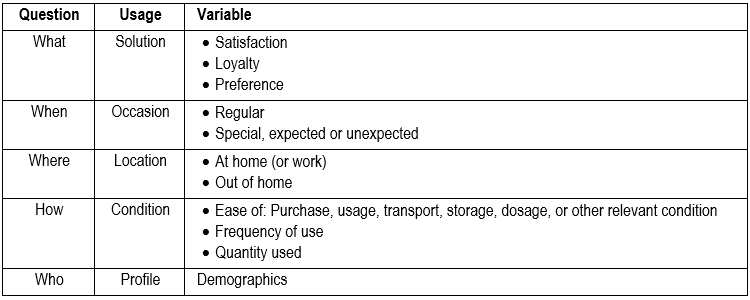
The Usage section of a U&A questionnaire investigates how consumers use products.
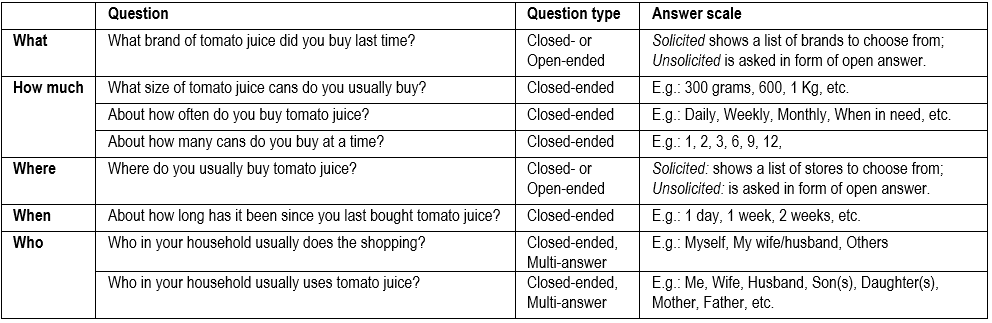
Typically, respondents are asked questions of the kind: What, when, where, who, and how concerning the purchase, usage, and possession of products. Again, the Why-questions are asked in the Attitude section of the study.
For instance, to investigate the usage of tomato juice we could ask the following questions.
Purchase of tomato juice.
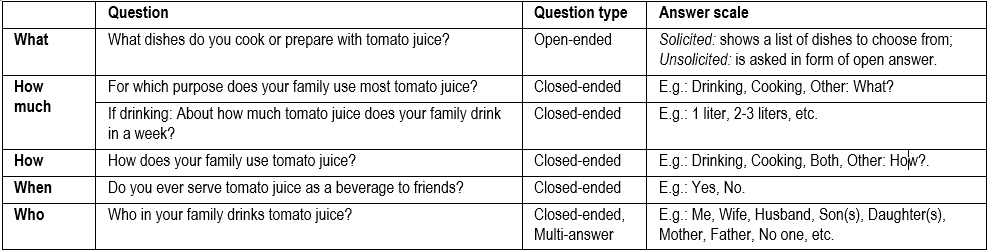
Usage of tomato juice.
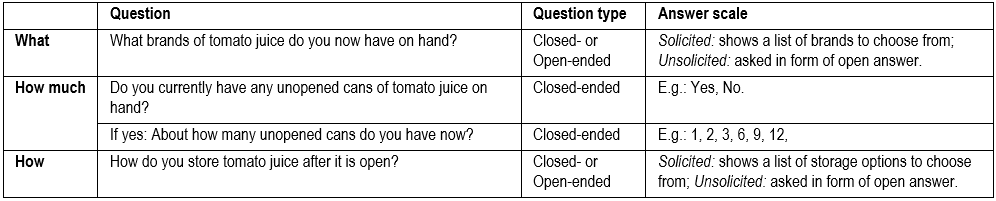
Possession of tomato juice.
How to investigate Attitude
An attitude is a predisposition to act in a certain way. An opinion is the verbalization of an attitude.
For instance, a survey respondent answering “I prefer natural yogurt to flavored yogurt“ expresses an opinion that underlies an attitude toward yogurt.
The following is a discussion on how to derive a measure of attitude.
Scale reliability
Attitudes cannot be measured directly. They are psychological constructs, aka latent variables, that must be inferred from other, measurable variables. For instance, Bolton, Kannan, and Bramlett (2000) created a 4-item, 5-point Likert scale (ranging from Strongly agree to Strongly disagree) to measure one’s attitude toward a particular brand of credit card:
-
- [Brand name] is a product you can depend on in times of emergency.
- [Brand name] is good for travelers.
- [Brand name] is best for business people.
- [Brand name] is a prestigious product.
This scale, intended to measure product benefit, returned a Cronbach’s alpha of 0.76, which suggests the scale is consistent and it can be assumed it measures a common construct, in this case Own Satisfaction with the product.
Attitude rating scales
The different ways to collect attitude ratings from respondents to a marketing research study can be classified in two major groups: Single-item scales and Multiple-item scales.
Single-item scales measure a construct using one item only.
For instance, the overall satisfaction with service can be measured with an unbalanced Likert-like scale as follows:
Extremely satisfied, Very satisfied, Somewhat satisfied, Unsatisfied.
In this scale:
-
- All answer classes are labeled
- Respondents are forced to give an answer (no Don’t know answer option)
- There is unbalance towards favorable classes
- There is no comparison to similar products (e.g., of competing brands)
Usually, unbalanced scales are preferred when it is known, for instance from previous marketing research studies, that the respondents will provide answers skewed toward one end of the scale.
A Don’t know class should be available when we believe (or know) there may a relevant share of respondents unable to give a trustworthy answer.
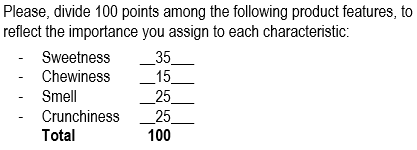
With the Constant-Sum scale respondents are asked to allocate 100 points across the several answer options. This scale is increasingly used to measure attitudes. For instance:
The same question measured with a Differential Semantic scale would return a different attitude score because it is a balanced scale.
The original Osgood, Suci, and Tannenbaum’s scale consists of a horizontal space divided into seven blocks with, at the two ends, two antonyms, such as Satisfied and Unsatisfied. Osgood respondents were instructed about the meanings of all the points on the rating scale, where the midpoint meant Neither satisfied, Nor unsatisfied.
In our example, respondents are instructed to mark a space to judge their satisfaction or dissatisfaction with a brand.
![]()
The semantic differential technique is frequently used in research today, but it is administered slightly differently from the original Osgood’s procedure. The horizontal line is presented without intermediate labels, and the end points are not labeled extremely. Scores are usually assigned values equal to 1, 2, 3, 4, 5, 6, and 7, from negative to positive response. In this case too, the respondent’s attitude score is the average of the scores.
![]()
Multiple-item scales are often used to measure abstract constructs, like IQ or consumer satisfaction.
Creating multiple-item scales is a multifaceted process that involves several steps. It may require several survey studies and a long time to create a valid and reliable attitudinal scale.
Transforming respondent answers to different questions into values that can be aggregated in a single attitude score is commonly done by weighting the answer scale.
For instance, say we ask users of dishwashing soap to express their level of satisfaction with the following four items (referring to a single brand) using a 5-point Likert’s scale:
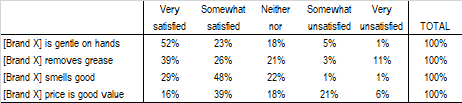
The way we collect and weigh this data returns different overall attitude scores, in this case concerning dishwashing soap.
Scaling procedures
To measure an attitude from a scale we apply some scaling procedures to the raw data.
Attitudes are formed by 3 related components that can be measured in different ways:
-
- Knowledge. Refers to awareness, beliefs, and judgements, usually expressed in terms of agreement with one or more statements and measured with Likert-like scales
- Liking. Likes and dislikes are often collected with open-ended questions, which require coding the data in order to conduct quantitative analyses. In other cases, liking data are collected with rating, ranking, ordering, and other methods.
- Intentions. Refers to the intention to act with respect to some activity like purchasing, re-purchasing, visiting a store, watching a movie, browsing the web, or any other action. This data is often collected with scales of agreement and probability.
Weighting scales
Many scales can be weighted in order to create equally spaced answer classes, which is a desirable property of attitudinal scales.
Two weighting approaches are particularly popular:
-
- Symmetric weights, like: +2, +1, 0, -1, -2.
- Progressive weights, both ascending or descending, like: 1, 2, 3, 4, 5 or 3, 2, 1, 0 respectively.
For instance, the table below shows the data of the previous table transformed into weighted scores applying symmetric weights.
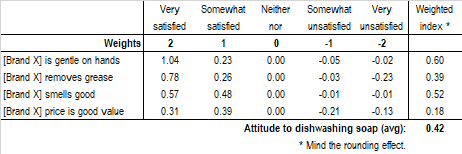
In general, we need as many weights as there are answer classes in a scale. In this case we derive a weighted index for each item (row) of the table by multiplying each class by the respective weight. For instance, weighted index of item “gentle on hands” was obtained with:
0.60 = [(52% * 2) + (23% * 1) + (18% * 0) + (5% * -1) + (1% * -2)] / 2
The division by the largest weight, 2 in this case, expresses the attitude index in percent and makes the interpretation easier.
Finally, by averaging all weighted indexes we obtain the Attitude score towards dishwashing soap equal to 0.42.
The same approach holds for the application of progressive weights. In this case, however, using descendent weights in the range 5-1, the Attitude towards dishwashing soap rises to 0.77.
Another way to obtain attitude scores results from changing the answer scale from Likert to, for instance, an agreement or satisfaction scale measured with progressive values, say, from 0 to 10, where zero means Completely unsatisfied and 10 means Completely satisfied.
Then we ask a second question about the importance of each feature, for instance, on a scale 1 to 5 from the least to the most important.
The weighted scores result from multiplying the satisfaction score times the importance weight, both computed by averaging the scores of all respondents to the respective question.
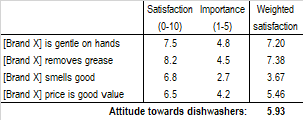
For our example, averaging all weighted indexes produces an Attitude score towards dishwashing soap equal to 5.93.
Intuitively, there must be computational homogeneity between attitude scores in order to make them comparable across brands or other characteristics. Once we opt for a procedure we must apply it consistently to all related questions.
Comparing attitude scores across brands
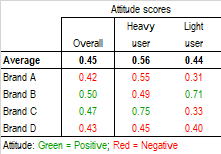
When a U&A study investigates several brands (sequential) it is recommended to compare brands with Overall attitude scores as well as split scores by the answers to the Fix data. The following table shows an example of split scores between Heavy and Light users of a given product.
Reading the Overall column, we notice that two brands exhibit an attitude score above the average score of all brands (positive attitude) and two brands lie below the average score (negative attitude). The situation changes when the Overall scores are decomposed for the Heavy and the Light users. Brand B shows a positive attitude among Light users only while Brand C has a positive attitude among Heavy users only. This information may lead to completely different interpretations of the survey data and to different business decisions.
Limitations of scaling procedures
The concept of psychological measurement has always attracted the interest of marketers and researchers. Doing so with marketing research investigations, however, is not free of limitations.
First, although psychological states of mind are seldom governed by a single variable, more has been done on measuring attitudes along a single dimension than has been done on measuring the more complex multidimensional attitudes. This testifies to the complexity researchers have faced while trying to develop some sort of normative approach to a problem without easy solution.
Moreover, we still know too little about the influence other persons have on the formation of one’s decisions and habits, which poses a limit to the use we can make of attitude scores and other psychological measures.
For these and other more technical reasons, like the lack of appropriate scales for the measurement of multidimensional stimuli, attitude scores should be used with caution and only after the process that generated the score is fully understood and validated.
Repeating the same study several times is an empirical approach often used to validate findings in marketing research.
Try LogRatio’s fully automated solution for the professional analysis of survey data.
In just a few clicks LogRatio transforms raw survey data into all the survey tables and charts you need,
including a verbal interpretation of the survey results.
It is worth giving LogRatio a try!
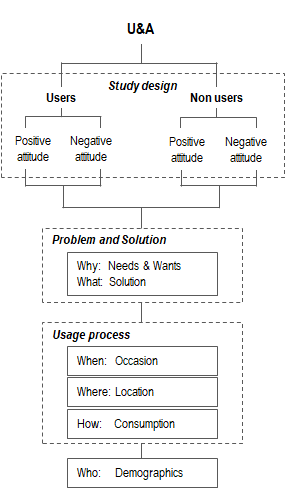
U&A study logic: Pulling it all together
The following image summarizes the possible structure of a questionnaire administered during a Usage & Attitude marketing research study.
Sources:
Bolton Ruth, Kannan P.K., and Bramlett Matthew D. (2000), Implications of Loyalty Program Membership and Service Experiences for Customer Retention and Value. Journal of the Academy of Marketing Science.
Osgood Charles, Suci George, and Tannenbaum Percy (1957), The Measurement of Meaning. University of Illinois Press.
Dolores Albarracin, Blair T. Johnson, Mark P. Zanna (2005), The handbook of attitudes. Lawrence Erlbaum Associates, Inc.