Shame on YouGov! Did their market research survey really miss the outcome of the Brexit consultation? Not quite. If you hit your finger while hammering a nail into the wall, do not blame the hammer.
The media circuit is responsible for having broadcasted inaccurate information. I must confirm that I am in no way linked to YouGov, the market research agency that supplied most media agencies with projections of the outcome results for the Brexit consultation in the UK, and this article isn’t meant to defend YouGov, who in fact made some mistakes. This article aims to help better understand how to read and use survey data, in order to avoid trivial mistakes and wrong conclusions.
Market research survey figures vs. confidence intervals
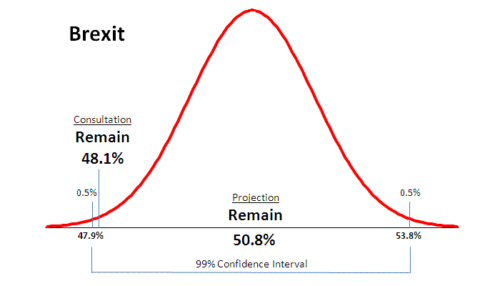
When researchers plan survey studies they take into account a number of constraints, including the client’s budget, the confidence interval, the standard error and the hypothesis of the study. This means that although the survey may deliver a single figure, such asRemain: 50.8%[1], such a figure must be understood as an interval where 50.8% stands for the interval middle-point.
Unfortunately, far too often media agencies consider their audience unable to grasp articulated information, so they simplify it in an attempt to help us understand. In the case of Brexit this has been the main reason why most, if not all, TV channels and other information media broadcasted wrong information: They did not account for the confidence interval around the mean value, and they made a mess. What is even worse, they blamed YouGov for having done a bad job. That is not true, although they do bear some responsibility. Read further to understand why.
Try LogRatio’s fully automated solution for the professional analysis of survey data.
In just a few clicks LogRatio transforms raw survey data into all the survey tables and charts you need,
including a verbal interpretation of the survey results.
It is worth giving LogRatio a try!
How to construct confidence intervals
Between June 20th and June 22nd, 2016, YouGov gathered 3’766 interviews for the Brexit survey. 3’361 persons expressed a clear opinion, and the share of people votingRemain turned out to be 50.8% ( Xbar ).
Assuming they sampled the universe of people registered to vote at the 99% significance level and the hypothesis of the study was 0.5, the error level was 2.2168% (e). To construct the confidence interval around 50.8% we just need to solve for:
![]()
Where Z is the normal standard variate and at the 99% significance level turns out to be 2.57583134. It is easy to obtain our Z value with Excel: simply type[2]=NORMSINV(0.995). So, the interval for the share of Remain is:
![]()
At the end of the consultation the share of people who had voted for Remain was 48.1%, and this number falls exactly in the confidence interval as it was predicted by YouGov, on the lower side, I agree, yet perfectly within the interval.
YouGov did not miss the Brexit results. The information circuit broadcasted inaccurate news.
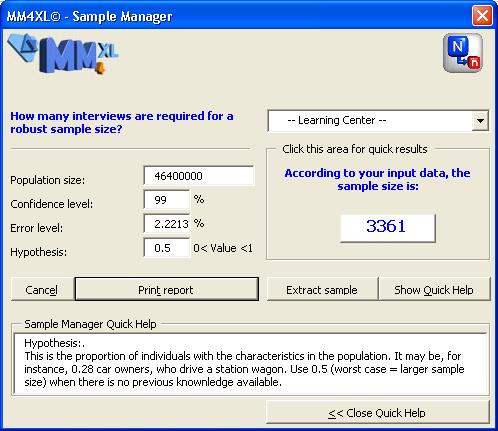
Image 1: Error level for the YouGov Brexit survey
How could YouGov have improved their market research projections?
YouGov might have been bound by the client’s budget constraint[3], which in turn did not make it possible to reduce the standard error, and the survey carried a probability slightly above 69% to predict a Brexit result above 50%, a far too low level for such an important survey.
However, the real issue here was not the sample size, but rather the sampling process. More specifically, the weighting process made a strong contribution to the delivery of questionable results.
Why weighting market research survey results
Weighting is used to make sure samples reproduce the underlying characteristics of the population they are drawn from. For instance, in the UK 51.6% of voters are women, of these 22.5% are above 65 years of age, 23.1% have a higher education and so on. The people selected to make part of a sample may be recruited to ensure they match these proportions.
Within the context of weighting there are two major sampling procedures: Quota and stratified sampling. The relevant difference between them is the latter uses some sort of randomization device while with the former the interviewer decides whether or not to interview a person with certain characteristics. YouGov presumably applied Quota Sampling for the Brexit survey[4], and the gender, age and education weights they applied are shown in the following image.
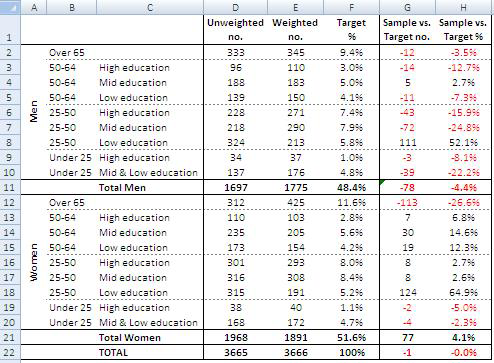
Image 2: YouGov data weights as reported in their file TimesResults_160622_EVEOFPOLL.pdf. Elaboration Mirio E. D. de Rosa
What went wrong with the sampling procedure is evident from the values in column G and H of image 2. YouGov over-sampled women vs. men, women over 65 were under-sampled, and both men and women in the classes 25-50 years old with low education were over-sampled. This required heavy data weighting, and the mess was underway.
Try LogRatio’s fully automated solution for the professional analysis of survey data.
In just a few clicks LogRatio transforms raw survey data into all the survey tables and charts you need,
including a verbal interpretation of the survey results.
It is worth giving LogRatio a try!
Closing
If you hit your finger while hammering a nail into the wall, you cannot blame the hammer. Information channels were responsible for broadcasting incomplete information, while YouGov should have paid more attention to their sampling procedure in order to reduce the effect of data weighting. Surveys are an extremely useful tool. But as with any other tool, we must make sure we use it correctly.
When buying a survey, always ask your agency for confidence interval around important values you will use for making decisions. The cost of drawing wrong conclusions may well exceed the cost of purchasing the service. Also, learn as much about statistics as you can. This will help you in handling and interpreting data correctly.
_______________________________________________________
[1] Source: yougov.co.uk, report TimesResults_160622_EVEOFPOLL.pdf.
[2] Note, for the 99% significance level we type 0.995 in the Excel function because the remaining 1% must be split in two: 0.5% is accounted by the lower-tail and 0.5% is accounted by the upper-tail of the normal curve.
[3] Assuming YouGov charged the client £20 for an interview, or roughly USD 30, the client’s budget can be estimated at around USD 100k. Not a huge budget considering the price TV channels charge to advertisers for a 30 second advertising spot. Perhaps it took them two to four spots to cover the whole cost of the Brexit survey.
[4] This assumption is based on the fact that they asked this filter question to skim respondents to be included in the sample: As far as you know, are you registered to vote in this week’s referendum on Britain’s membership of the European Union?