
Chances are your company isn’t ready to profit from the alluring promises of data analytics. You need to learn how to make and test hypotheses at scale before you can earn the title of Analytical Company. Read further. I am going to tell you how to develop analytical skills to move your business ahead.
A culture of data analytics
What is analytics? Take Netflix. Founded in 1997, Netflix offers on-demand streaming services. According to Neil Hunt, Chief Product Officer, Netflix was born with a culture of “quantitative testing”. And the sales progression shown in Image 1 leaves no room for doubt: business analytics work, at least for Netflix.
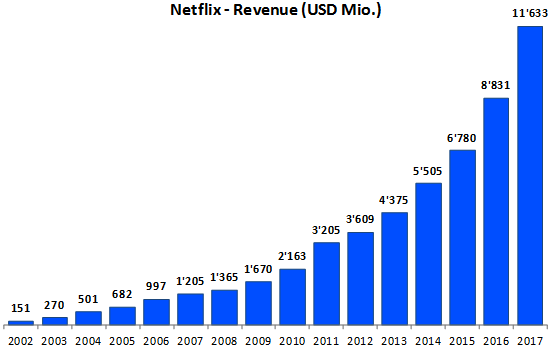
Image 1: Netflix annual revenue 2002 – 2017 (US$ Mio.)
Netflix surveys thousands of clients to test user experience, concepts, advertising material, awareness, and satisfaction in marketing, operations, and customer service. In customer experience, for instance, they run thousands of tests and measure tens of parameters related to customer behavior. Then they link the findings back to the customer rental and film rating history, to predict what the customer may like and offer it proactively.
This is analytics and the complexity of this process is the reason why, your company probably isn’t yet ready to profit from advanced analytics and AI.
Try LogRatio’s fully automated solution for the professional analysis of survey data.
In just a few clicks LogRatio transforms raw survey data into all the survey tables and charts you need,
including a verbal interpretation of the survey results.
It is worth giving LogRatio a try!
Model of analytics stages
Image 2 shows the five analytical stages companies (can) go through according to Davenport and Harries[1].
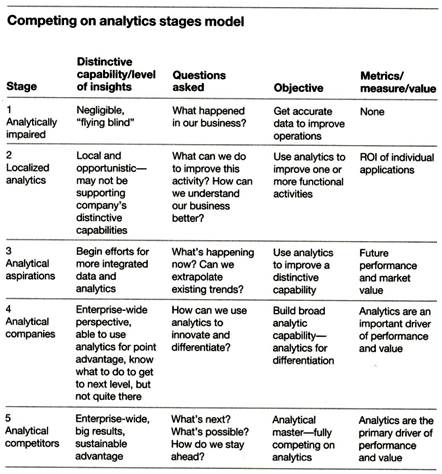
Image 2: Stage model of analytical companies.
Companies like Netflix, Amazon, Procter & Gamble, or Google are in stage 5. They are Analytical Competitors who have achieved great results by applying data analytics to everything they do, but this is a stage only very few companies reach.
The challenge for most companies today is to reach stage 3. To do so, I suggest exercising the basics of advanced analytics using internal data already available in-house, like purchase orders (PO) or website visits.
Growing into an analytical company
Becoming an analytical company begins with learning how to use the data you have in-house, like PO and website traffic.
Most companies do some sort of sales analysis. Analytic firms go one extra mile. They follow a structured process to:
-
- Slice sales data into hundreds of tables seeking large enough groups of customers with homogeneous buying behavior
- State hypotheses on how to identify and influence the behavior of customers with profile characteristics like people in those groups
- Setup and run experiments to test their hypotheses
Companies able to repeat this testing process at scale – that means hundreds or thousands of times – will end up finding improved ways to sell their products.
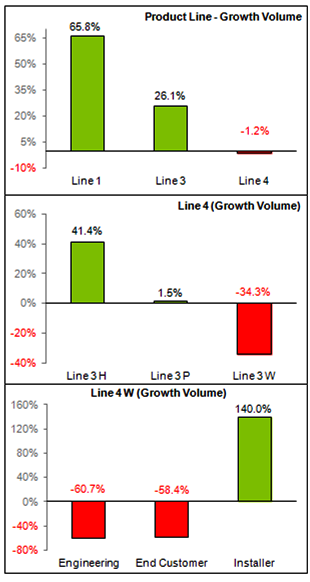
Image 3: Drilling down into the data.
For instance, we tabulated the PO of a B2B company. From three different tables we found that Product Line 3 in Image 3a is underperforming. Line 3 comprises three Product Types: H, P, and W. Only Type W, however, shows negative growth (Image 3b) and this is due to clients of the groups Engineering and End Customer (Image 3c). Having identified the source of the problem, making hypotheses on how to fix it is easier and more precise.
This approach is useful in several ways, including to:
-
- Further support well-performing products
- Rescue under-performing items
- Streamline or add items to the product portfolio
- Manage discount levels and profit targets
- Plan advertising activities and promotional actions
- Negotiate with suppliers and intermediaries
- Motivate employees
- And much more
Data structure: How to analyze sales data
Drilling into data of whatever nature requires a structured approach.
Although purchase order data won’t tell you Why customers bought, they can tell you Who purchased What, When, Where, and How. This information provides a solid foundation to develop meaningful hypotheses of how to improve business results.
Image 4 shows the key questions our sales data can answer, and how to drill down into the dataset in a structured manner using two-way tables like in Image 6.
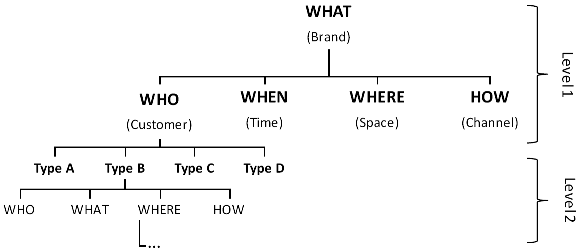
Image 4: Structured analysis of company’s internal data, like purchase orders.
Database: Sales analysis structure
In Excel arrange the data in the form of a database as shown with Image 5. Each row refers to one item of a PO, while column variables and metrics vary according to the data you analyze. For each variable of the dataset make one cross-table with each of the variables. The 15 variables of our example return a total of 225 tables like image 6.
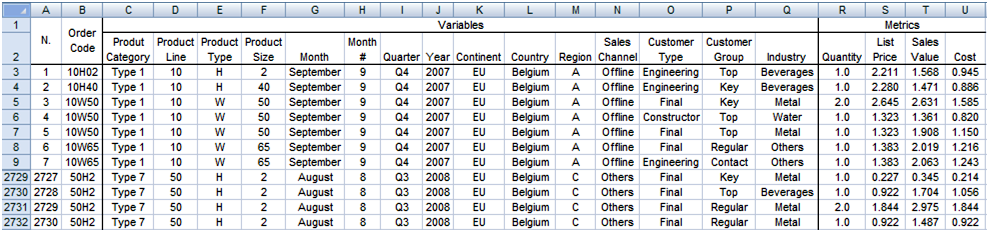
Image 5: Arranging data to run structured analysis.
We obtained the table in Image 6 by crossing the data in column N (Sales Channel) and C (Product Category) of Image 5. The measures in column A of image 6 vary according to the data you analyze. In our example we look at PO’s in volume, value, average sales price, overall profit, and discount level.
Wait! Don’t say “But we already do this”. I am sure you do. However, chances are you do not do it in the structured manner I am describing.
For all of your variables and for every period of time you set, say weekly or monthly:
-
- Make and print (yes, on paper) all tables
- Search for meaningful groups
- Make hypotheses
- Test your hypotheses
- Keep what works
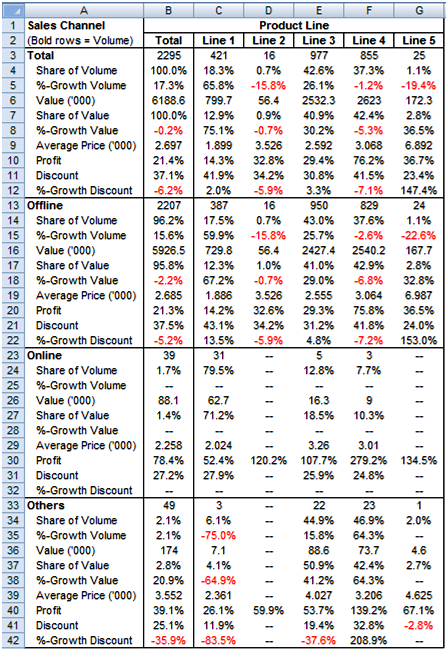
Image 6: Making hypotheses with cross-tables
The advantage of these tables goes beyond the simple queries of traditional CRM systems (Customer Relationship Management). They show a complex picture in a compact and informative way.
The key to extracting useful information from such tables is to follow a structured approach: cross-tabulate each variable with all other variables of the dataset. As shown with Image 3, the nested reading of cross-tables provides their greatest utility. Some tables will be more interesting than others, and in some cases one may want to dig deeper with three-way and higher order tables. Always drill deeper into the data and search for any issues that may have influenced the issue you are investigating.
In our example it is immediately clear that the discount growth in F22 of Image 6 dragged down sales in volume and value of the whole Product Line. At this point one could drill deeper and make hypotheses on how to recover the lost profit.
Hypothesis testing: How to use data analytics in marketing
The next step to develop advanced analytical skills concerns the ability to plan and administer large numbers of tests aimed at confirming the superiority of one concept over another. Continuing with the example from Image 3, for instance, we could state:
Hypothesis 1:
Extending the warranty time will convince significantly
more End Customers 45+ y.o. to buy Line 3W.
Testing hundreds of hypotheses like this allows the prioritization of promotional activities according to their expected return. Tables like Image 6 help in deciding which hypothesis to test first, second, and so on according to the past sales performance of the people the hypothesis addresses.
Over time, test results cumulate in the so-called prior knowledge. That is, base knowledge useful as a means of comparison and as analogy when making decisions in fields where we have only limited knowledge, such as when launching a new product in a market we have never competed in.
Master the hypothesis testing step and you will feel much more comfortable when dealing with more advanced data analysis and AI issues like:
-
- Finding paired purchases for upselling (basket analysis)
- Prospecting leads
- Profiling customers according to behavior and habits
- Predicting customer behavior
- Anticipating replenishment
- Making accurate and relevant recommendations to customers and visitors
- Classifying, predicting, and reacting to data patterns
- Setting dynamic prices in real time
- Increasing customer engagement (e.g. with auto-generated, brand-specific, personalized content)
But again, you can only run if you first learn to walk. And the analysis of PO’s is where you get fit to play a more advanced game on the artificial intelligence field.
Closing
Companies like Netflix were born with a business analytics attitude and competence. Other companies make efforts to grow their analytical competence, like Novartis that, according to its new CEO, Vas Narasimhan, is going to evolve into a “medicines and data science” company. Most companies, however, struggle with Stage 3 of the analytics company model (see Image 2).
Learning how to handle data to extract the information it contains is the way to evolve, and it should begin in the sandbox of company internal data, like sales data and purchase orders. This is the place to learn to make fact-driven hypotheses. The next skill to develop is the capability to test the hypotheses you make and then use their results to move the business ahead.
[1] Davenport and Harries, Competing on Analytics. Harvard Business School Press.