
Satisfaction surveys monitor the level of satisfaction of customers, employees, or other group of people concerning selected activities executed by a company, brand or other entity.
Trying to relate satisfaction to sales levels, market share, brand loyalty or other metric is wrong because these measures result from the nested effect of way more variables than satisfaction alone. Satisfaction relates more to efficiency and control rather than to performance and competitiveness. Read also about the mistake of linking advertising to sales in our post Copy test.
How to design the satisfaction measurement model
The satisfaction model determines the hierarchies between variables of the survey.
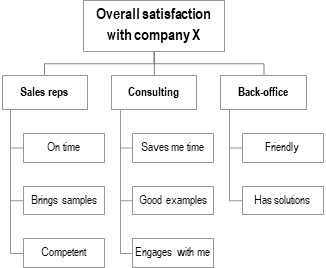
For instance, the results of a qualitative study with company customers could indicate that the “Overall customer satisfaction with company X” results from the level of customer satisfaction with three areas of the company activity: Sales reps, Consulting services and Back-office support (see image below).
In turn, the overall satisfaction with each area of activity depends on the satisfaction with the features of that area. In our hypothetical case, for instance, the customer satisfaction with the Sales reps depends on the satisfaction with the fact that they come On time to appointments, Bring product samples, and are Competent about the company products.
The model hierarchy could look as in the image that follows, and could go deeper, although it is a good habit to keep satisfaction models short and meaningful.
This modeling approach has the important advantage that it can quantify the contribution of each variable to the overall satisfaction.
This means that this approach avoids respondent fatigue because it is not necessary to ask how important each feature is. The only question respondents are asked is their level of satisfaction with each element of the model.
Read our post How to measure customer satisfaction correctly. It explains how to quantify the contribution to satisfaction of each variable. This is useful information to prioritize the activities conducted to improve the satisfaction level, of customers in this case.
Satisfaction data collection and analysis
The collection of satisfaction data is a rather monotonous activity that keeps asking questions like this one:
On a scale from X to Y, how satisfied are you with [TOPIC]?
Different answer scales can be used. Once chosen, however, the selected scale must be used consistently throughout the whole study; a consistent base of data allows you to consolidate the survey results in comparable indexes as well as to quantify the contribution of each variable to the overall satisfaction.
Again, read our post How to measure customer satisfaction correctly for a detailed discussion of how to gather and analyze satisfaction data.
Read also the post Shall we increase the customer satisfaction index or decrease indifference and dissatisfaction? It explains, among other things, how to prioritize activities aimed at increasing (customer) satisfaction.
Try LogRatio’s fully automated solution for the professional analysis of survey data.
In just a few clicks LogRatio transforms raw survey data into all the survey tables and charts you need,
including a verbal interpretation of the survey results.
It is worth giving LogRatio a try!