Defining customer satisfaction with a single value, like the Customer Satisfaction Index (CSI), Net Promoter Score (NPS®), Customer Satisfaction Score (CSAT), Customer Effort Score (CES), or other index, may prove ineffective and expensive.
This article discusses a more accurate approach to measuring consumer satisfaction.It exposes the major limitations of measuring satisfaction with traditional indexes and scores. Then it describes how to measure customer satisfaction, indifference, and dissatisfaction. Finally, the article shows how to prioritize activities aimed at increasing customer satisfaction while reducing indifference and customer dissatisfaction.
On the Customer Satisfaction Index
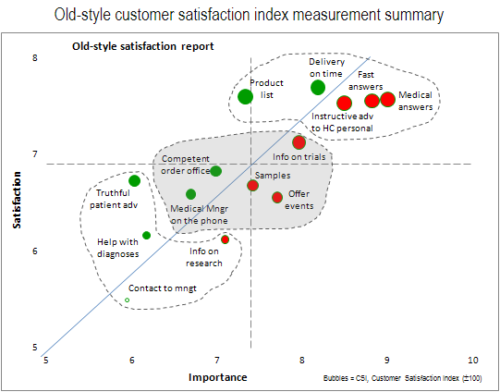
In some cases, agencies gather data using two questions: one about customer satisfaction and one about the importance of each attribute being investigated[1]. The average results of all attributes are then plotted, as in Image 1. The bubbles are set to the size of one of the several satisfaction indexes available, like the Customer Satisfaction Index, most often computed on a 5- or 7-level Likert scale. Finally, they cluster attributes and make recommendations.
Image 2 helps to explain why handling satisfaction surveys this way may be dangerous for the business. Read further.
Try LogRatio’s fully automated solution for the professional analysis of survey data.
In just a few clicks LogRatio transforms raw survey data into all the survey tables and charts you need,
including a verbal interpretation of the survey results.
It is worth giving LogRatio a try!
Customer satisfaction has four parts
Allocating resources to activities intended to increase the satisfaction of customers is not always easy. In fact, many programs aimed at improving satisfaction fail.
In a typical setup, satisfaction studies let respondents express their level of satisfaction with several attributes. Using a score, often ranging from zero or one to ten, customers express Satisfaction by judging attributes high and they express Dissatisfaction in two ways: By judging attributes low, and with Unassigned points. Scores that are neither high nor low indicate Indifference.
Therefore, a single customer score is the result of four simultaneous forces at work that we call SIDE Effects™:
-
- (S) Satisfaction
- (I) Indifference
- (D) Dissatisfaction
- (E) Earnable (or unassigned) points
Satisfaction attributes ranked according to their contribution to the above four forces allow a more effective activity selection and resource allocation, which may translate into a more profitable business.
Inaccuracy of old-style satisfaction measurements
Image 2 exposes the weakness of traditional methods, like the Customer Satisfaction Index, in capturing the correct relationship between customer satisfaction, dissatisfaction, and attributes.

Image 2: Depicting the inaccuracy of old-style satisfaction measurement.
The bubbles, hence attributes, are placed on the map according to their contribution to satisfaction and dissatisfaction as measured with the SIDE Effects™ method. The bubble size is set to the traditional Customer Satisfaction Index computed on a 5-point Likert scale (see Image 7).
The red bubbles of image 2 capture the inconsistency of the old-style measurement. These attributes have a large CSI, although they are associated with high levels of dissatisfaction.
This means that the activities companies put in place to increase or maintain the supposed high level of client satisfaction may in fact prove to be ineffective. To improve the satisfaction of clients with these attributes, you must instead counteract their dissatisfaction. In fact, trying to build satisfaction on these attributes may lead to losing dissatisfied customers faster because they may remain unresponsive to activities that so far haven’t produced the expected results.
The inaccuracy of traditional satisfaction indexes is confirmed also by the squared correlation values (R2) of Image 3. While Satisfaction is highly related to the Customer Satisfaction Index, Dissatisfaction is not. This means old-style measurements don’t capture the dissatisfaction aspect of the customer scores.
Read on. I will explain shortly how to use the SIDE Effects™ to prioritize activities aimed at increasing satisfaction and reducing customer dissatisfaction.
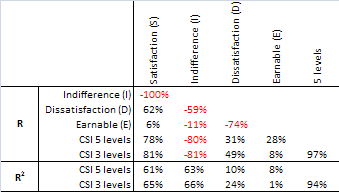
Image 3: Traditional satisfaction indexes don’t correlate with customer dissatisfaction.
The customer satisfaction data of our example
Using a score ranging from 1 to 10, 285 customers of a major pharmaceutical company expressed their level of satisfaction with 14 attributes supposed to be predictive of their satisfaction level with the company internal services. Image 4 shows the base data.
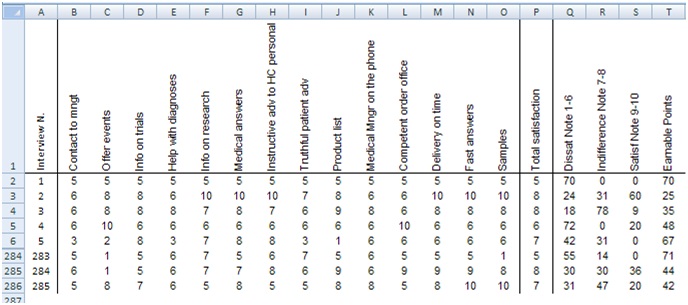
Image 4: Customer satisfaction scores of 14 attributes.
The variables of column Q:T are sums of scores. Columns Q, R, and S show the sums of scores falling in the respective ranges while column T, Earnable Points, represents the points that respondents have not assigned. For instance, the respondent of row three in Image 4 assigned a total of 115 points (6+8+8+ … +10). Of those points, 24 were assigned with scores lower than 7, 31 points with scores between 7 and 8, and 60 points with scores larger than 8. The max number of points that a respondent could assign is 140 (14 attributes times max score 10). Column T shows the number of unassigned points for the respondent or row three (25 = 140 – 115).
The three groups of respondent scores are arbitrary and defined in order to match the NPS®, also used by example company:
-
- Scores 9 and 10 express satisfaction with a given attribute
- Scores 7 and 8 express an indifferent position (neither satisfied nor dissatisfied)
- Scores 1 to 6 express customer dissatisfaction with a given attribute
Image 5 shows the same sums of scores as in the range Q:T of Image 4 but for the attributes instead of the respondents. The chart depicts the variability across attributes and for each of the four SIDE Effects™. The number on the right side of the attribute labels is the mean value of all scores for that attribute.
Take the attribute Delivery on time for instance. Its average satisfaction score and CSI are among the highest (see image 7). However, it’s apparent that its large share of indifference and dissatisfaction isn’t captured with traditional satisfaction measures.
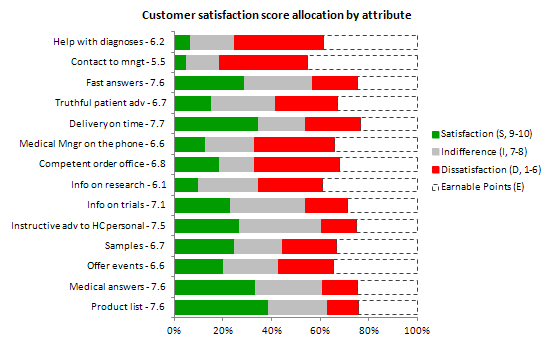
Image 5: Customer satisfaction score allocation by attribute.
Assessing attribute contributions to customer satisfaction, indifference, and dissatisfaction
The algorithm measures the contribution each attribute makes to the four SIDE EffectsTM by regressing the variables in the range Q:T of Image 4 against the 14 attributes of the columns B:O[2].
Confirmation of the explanatory models (R2)
The coefficients of determination in Image 6 show how the four models fit the input data. Only the Indifference scores are badly represented by our model (R2 = 11%), but this is an expected result. In fact, customer satisfaction surveys register the opinion of clients, and it is reasonable to believe that clients take a stand for the products they buy or use rather than remaining indifferent. When this isn’t the case, companies could consider investing in communication that aims to help customers form a definite idea of their products.
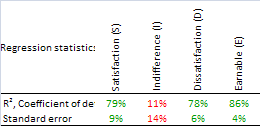
Image 6: Coefficient of determination of the four SIDE EffectsTM models.
Significance of the contribution of attributes to satisfaction and dissatisfaction
Image 7 reports the significance of the contribution (p < 0.05) of the single attributes to the respective model. Except for the Indifference model, only a few attributes have a non-significant contribution (red). This means the vast majority of attributes is well represented in the model[3] and they can be considered good predictors of the SIDE Effect they refer to.
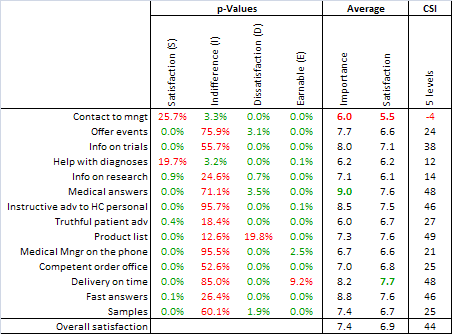
Image 7: Significance of the modeled satisfaction attributes.
It is worth noting that the attributes Contact to management and Help with diagnosis of the Indifference model do exhibit significant values; moreover, they have low average values of Satisfaction and Importance as scored by the customers. This may mean these two attributes play a relevant role in influencing the indifferent position of customers.
SIDE EffectsTM: Advanced customer satisfaction measurement
Perhaps the most interesting feature of measuring customer satisfaction with the SIDE EffectsTM method is that the coefficients of the attributes approximate the influence each attribute exerts on the corresponding SIDE Effect.
For instance, attribute Help with diagnoses contributes to increase (S) model by 1.3% and it raises (I) model by 3.3%; on the other hand, this attribute contributes -2.9% to the (D) model and -1.6% to the (E) model.
Although these values should be used with caution when estimating the impact of activities on overall customer satisfaction, indifference, and dissatisfaction they supply a valid alternative to rank the contribution of the individual attributes and therefore the priority of intervention.
Image 8 shows the contributions of the four SIDE EffectsTM to overall customer satisfaction. The sum of the four coefficients of each attribute equals zero (mind the rounding effects), which underlines the fact that the absolute value (for instance the average of all scores) of each attribute is the joint effect of these four forces.
Image 8: Contributions to customer satisfaction, dissatisfaction, and indifference.
I expect some statistical analysis purists to raise concerns about the methodology. However, and in light of what Jeff Bezos said in one of his annual letters to shareholders, business decisions can seldom rely on perfect information.
The SIDE Effects™ method for measuring satisfaction, indifference, and dissatisfaction helps you make faster and better informed decisions about the satisfaction of customers. Reading the trend of the measurements adds information that permits even more accurate decisions.
How to interpret the SIDE EffectsTM coefficients
Intuitively, it makes sense that the coefficients of dissatisfaction have a negative sign while satisfaction ones are positive; in fact, they subtract and add value to the client satisfaction scores, respectively. It is also acceptable to see negative coefficients for the Earnable points, because they haven’t been assigned by customers, which means they have been subtracted from the overall satisfaction score. The Indifference SIDE Effect shows mixed values, which I interpret as evidence of a not clearly defined position of consumers against the brand or company in question.
Satisfaction and dissatisfaction are the two ends of the same chain, and their effect on overall customer satisfaction should be judged by comparison. To do so we derive two dimensions:
-
- Net contribution to customer satisfaction (S + D). This is the sum of the coefficients of Satisfaction and Dissatisfaction.
- Total contribution to customer indifference (I + |E|). This adds together the Indifference coefficient and the absolute value of the coefficient of Earnable
Plotted on a scatter chart, the two dimensions form four quadrants. Image 9 suggests how to deal with attributes in each quadrant.
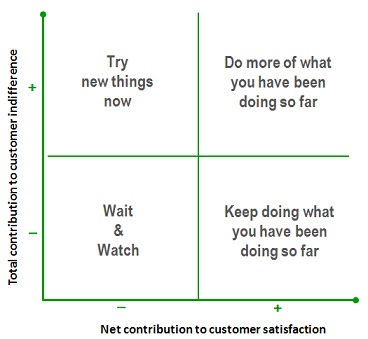
Image 9: How to interpret consumer satisfaction attribute positions.
The map in Image 10 plots the two derived dimensions for our survey example and sets the bubbles to the size of the Satisfaction (S) coefficients.
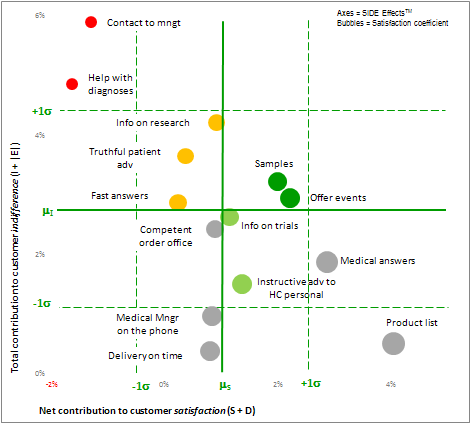
Image 10: Attribute net effect on satisfaction and dissatisfaction.
How to read the map of SIDE Effects™
The map in Image 10 has four main quadrants.
The left side
The upper-left quadrant hosts attributes with a net contribution to satisfaction (S + D) that is below average (mS) and indifference above average (mI); these attributes may need immediate attention to reduce customer dissatisfaction.
The lower-left quadrant also hosts attributes with a net contribution to satisfaction (S + D) that is below average but their indifference values are below average; these attributes may be assigned lower priority for intervention to increase satisfaction.
The right side
Attributes in the upper-right quadrant have contributions that are above average for both satisfaction and indifference; these attributes demand higher priority to increase satisfaction by lowering indifference.
Attributes in the lower-right quadrant also have contributions to satisfaction that are above average yet their indifference level is below average; this is a strong position that should be maintained, preferably with activities like those conducted so far.
The lower half
Due to their relatively low indifference and high satisfaction, the attributes with a grey bubble in the lower half of the map may be assigned lower priority for intervention. An exception may apply to the two light green bubbles, which may be candidates for increasing satisfaction.
In order to assign priorities for intervention with more accuracy, each main quadrant splits into four sub-quadrants according to the distance of one standard deviation, plus and minus, from the average value (mS, mI) of each dimension.
How to interpret the map of SIDE EffectsTM
The very purpose of the SIDE EffectsTM method is to help increase satisfaction by reducing the impact of dissatisfaction, indifference, and the share of unassigned points. With communication activities, marketers must convince customers to take a positive stand about the attribute, brand, or company under investigation.
The bubble colors have a meaning:
-
- Red bubbles: Immediate intervention to reduce dissatisfaction
- Orange bubbles: Next candidates to reduce dissatisfaction
- Green bubbles: First priority to increase satisfaction
- Light green bubbles: Next candidates to increase satisfaction
- Grey bubbles: Watch and wait
The disposition of attributes on the map in Image 10 suggests three measures aimed to:
-
- Reduce dissatisfaction. Bubbles in the upper-left side of the map may require activities to lower dissatisfaction rather than increasing satisfaction. For instance, an extension of the survey used in this article shows that the high dissatisfaction with Help with diagnoses was due to the relatively low competence of the company personnel assigned to this job. Up to that point, however, the company had prioritized the frequency (instead of the quality) of interaction with the customers, which in fact did nothing but increase the dissatisfaction of their clients. Reinforcing the team of scientific advisors with better-trained employees produced results in a matter of months that they hadn’t reached in years.
-
- Increase satisfaction. The green and light-green bubbles on the right side of the map may require activities to increase satisfaction rather than acting on dissatisfaction. For instance, the physicians of our survey appreciate product Samples and various kinds of information. More of these activities could increase satisfaction; for the light-green bubble it may be worth testing activities different from those run so far.
-
- Don’t rock the boat. Grey bubbles have a lower priority of intervention as long as their contribution to indifference is below average and their contribution to satisfaction is relatively high.
Closing
It has been shown that traditional satisfaction indexes, like the CSI, NPS®, and others, do not measure satisfaction accurately because they have a weak relationship with customer dissatisfaction and indifference.
To increase satisfaction in a targeted way and with a reduced risk of failure, companies should diversify their activities between those aimed (1) to increase satisfaction, (2) to reduce dissatisfaction, and (3) to convert indifference into awareness.
Each customer satisfaction attribute relates to the four SIDE EffectsTM with different intensity. Measuring these intensities makes it possible to influence the satisfaction of customers in a targeted manner.
Read also How to measure customer satisfaction correctly
______________________________________
[1] How to measure customer satisfaction correctly explains how to deal with badly represented attributes.
[2] For confidentiality reasons, we do not disclose the complete algorithm in this article, just the part necessary to demonstrate its stability and validity.
[3] Collecting both Satisfaction and Importance scores produces excessive respondent fatigue which may lead to collecting biased responses. Our previous article How to measure customer satisfaction correctly explains how to measure satisfaction without gathering the Importance scores.