The Concept test is marketing research conducted to assess the acceptance of a concept.
The acceptance is one of the three pillars of the Product Strategy. Therefore, we understand the Concept test as an early marketing research activity that aims to verify the end-user acceptance, hence preference, of a product concept.
So the Concept test was not developed to test every aspect of a strategic plan; it was created to measure acceptance. The Copy test is commonly used to measure the preference of communication and advertising messages; the U&A study helps in estimating market size, shares, and more; Product tests assess brands’ performance. Be clear on what you want to measure. There is an appropriate research approach to each problem.
The acceptance of a product concept consists in the approval, or favorable reception, of the potential product users. Recording positive acceptance is an important validation of the appropriateness of the Product strategy, though this does not mean that the product will necessarily be successful on the market. The message of the Concept test is that the product is fit for the job. Success, however, requires that all other strategic elements are a fit too.
Kinds of concept tests
Concept tests take one of three kinds of design:
-
- Monadic. Only one product concept is tested, typically asking the respondents to evaluate it according to their own experience with a similar product they commonly use, whatever that product is. This test setup allows you to estimate reference values, like the market size, if conducted with a sample of respondents selected in a random way from the whole population of the users of that product category.
-
- Paired-comparison. Two or more product concepts are compared, usually against a so-called control product that could be the market leader or another competitor. This test setup is typically conducted with three or more groups of respondents split according to a relevant discriminant characteristic, for example, Users and Non-users. It is desirable to have groups of equal size in order to test for the significance of the differences. Therefore, this test setup is not suited for making estimates of a market size, market shares, and the like.
-
- Hybrid. This test setup is a mix of the two kinds above. It is more complex to design than the other two, and is more expensive because each arm of the study requires a large number of respondents in order to provide useful results. But it has the advantage of being representative and comparable at the same time. Keep reading, an example of a hybrid Copy test design follows.
Concept test design
We discuss a hybrid Concept test designed to assess 4 new concepts against a control product already on the market.
The control product is simply the standard to which the experimental concepts are compared. In our example we test 4 new concepts that could lead to develop a new product that could either replace the control one or become an extension of the product line.
The hybrid form of the Concept test as discussed in this post covers both the Monadic and the Paired-comparison forms of the test design.
In this example the selection of the control product is determined by the objective of the test. In other cases, when the selection of an appropriate control product is not intuitive, we can look for a direct competitor, either externally from a competing brand or company, or internally from the same product line.
In the rare event you are launching a product in a completely new market, apparently without competition, look further. There is (almost) always a way to solve a problem, and that could be the surrogate solution to test your new concept against. In fact, the Concept test assesses the product acceptance, and the technical performance is the pivotal element to test about.
Try LogRatio’s fully automated solution for the professional analysis of survey data.
In just a few clicks LogRatio transforms raw survey data into all the survey tables and charts you need,
including a verbal interpretation of the survey results.
It is worth giving LogRatio a try!
An example of Concept Test
This is a real case of a brand revitalization. After acquiring the brand, the new ownership decided to verify the feasibility of a brand relaunch aimed to refresh and rejuvenate the brand and set more ambitious objectives.
The current brand promises to “maintain skin hydration”. Its Strategic positioning says:
[Brand X] helps women keep their skin younger-looking, whatever their age
and the Marketing objective requires:
to reach market leadership through an extension of the user base.
These are the strategic foundations that orientate the building of strong brands as well as the conduction of marketing research tests.
In an attempt to expand and reinforce the product benefit, the new management is working on an improved formulation. Lab tests confirm that the new formulation results in improved skin hydration because it gets deep into the skin faster and in larger quantity than the current formulation.
Four supposedly viable product concepts have emerged. The management wants to find out which one receives the favor of the end-users and decides to test the four concepts against the current product (control).

There are differences in terms of Product Strategy between these concepts.
The judgement of the end-users can help the brand management to make a hard decision concerning the product development direction to take:
-
- Concept 1 adds nourishment elements to the product formulation
- Concept 2 adds stimulants to the product formulation
- Concept 3 promises a long-lasting action
- Concept 4 claims product superiority, which implies at least equal performance to specialist brands
The logic of the Concept test
There are two arms and 5 groups in this test.
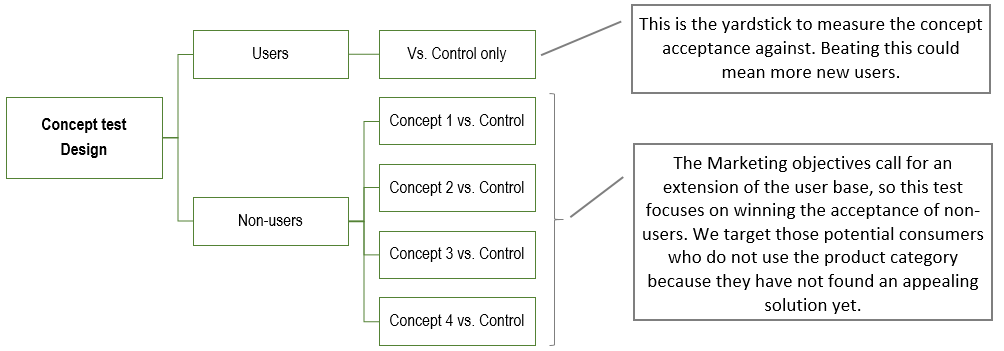
The respondent recruitment begins with a filter question:
During the last 4 weeks have you used a product to hydrate, nourish, protect your facial skin?
Respondents who have used a product are investigated only about the control product (to provide reference values to measure against).
Respondents who have not used a product are split into 4 groups. Each group is asked about only one of the 4 concepts compared to the control product.
In order to detect significant differences, all groups are of equal size: 300 respondents in this example. Samples of this size carry an error level equal to 5.66%, which is a reasonable uncertainty level for the purpose of testing concepts.
Concept test questionnaire design
The typical questionnaire of a Concept test is semi-structured (includes both open- and closed-ended questions), short, and comparable between arms of the test.
In our example, both arms investigate the same characteristics with comparable questions.
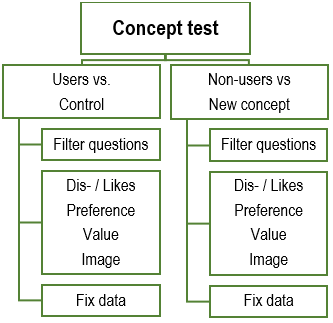
The core section of the questionnaire investigates four topics in each arm. The only difference is that Users answer only about the Control product while Non-users answer on both the Control product and one of the four new concepts.
Try LogRatio’s fully automated solution for the professional analysis of survey data.
In just a few clicks LogRatio transforms raw survey data into all the survey tables and charts you need,
including a verbal interpretation of the survey results.
It is worth giving LogRatio a try!
Interviewing respondents of a Concept test
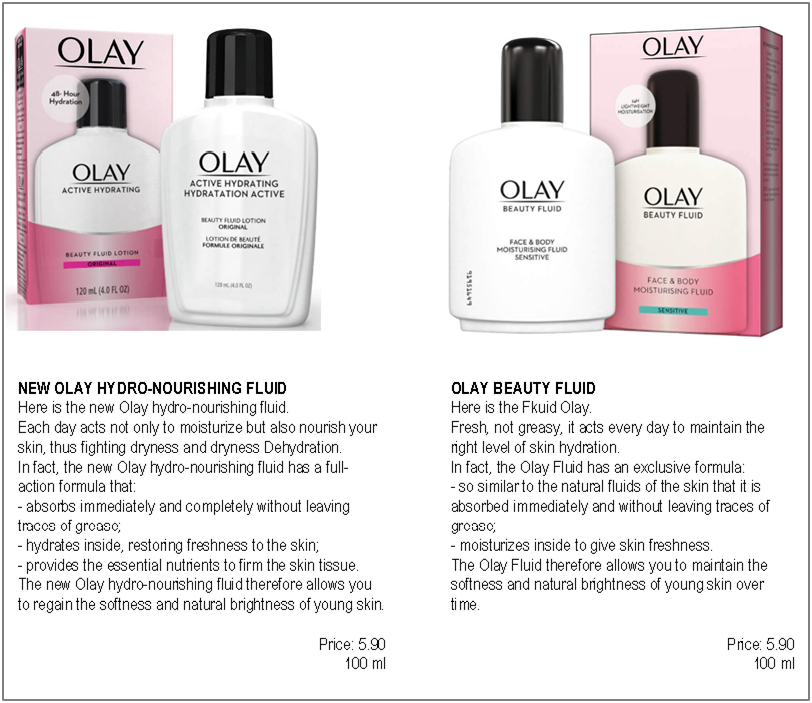
After the filter questions, each respondent receives a short description of the concept and/or product to be judged. For instance:
Please read the description of this product carefully and, while answering the questions, imagine that this product is just as described. Neither better nor worse than what is written on the cardboard which I recommend you reread whenever you see fit. It would really help us if you could be as clear as possible. For example, instead of writing “it is good” write the reasons why you think it is good.
In our example the card shows only the description of the control product.
The descriptive card shown to Non-users resembled the following image:
The questionnaire begins with the open-ended questions regarding Likes and Dislikes.

These are important questions that help to materialize the objects of the test in the minds of respondents. Moreover, they are important because, when appropriately coded, the answers to open questions are used to derive the Attitude scores of the test, which play a key role during the interpretation of the test results. In a few paragraphs we will discuss how to analyze the data of a Concept test.
The remaining questions of the test are closed-ended, easier to administer, and conceived to be transformed into comparable indexes useful for judging the relevance of the single concepts.
The main challenge with closed questions is choosing an appropriate answer scale. There are two kinds:
-
- Balanced
- Unbalanced
They differ in the way the answers are weighted in order to obtain an index comparable between concepts and the control product.
The answers of a balanced scale have an equal distribution of answers classes going from positive to negative, or the other way around. Their weights follow the same schema. The following table shows a balanced answer scale with two positive answers, one neutral, and two negative answer options:
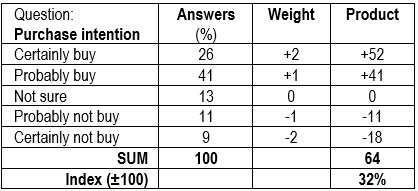
According to the table above, the Purchase intention index can range between +100 and -100. The value 32% is obtained by dividing 64 by the largest weight, 2 in this case. As a standalone value this index does not mean much. However, read against comparable values of different concepts, this and other indexes help in interpreting the results of a Concept test in a meaningful, faster way.
The same process applies to the answers of questions using an unbalanced scale, just the weights change. For example, the next table shows four positive answers, one neutral, and one negative answer:
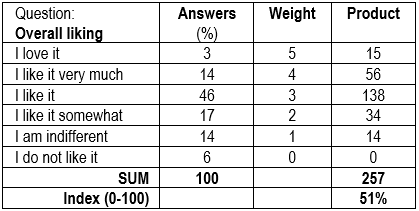
The weighting process compacts all the answers to a Concept test in a few indexes that are easy to compare and to interpret even by less expert readers.
Concept test summary results
The following table shows the summary results for the Concept test in our example.
The complete elaboration includes lots of cross tables that supply all the details. This table summarizes only the key ratings, expressed in index form. This way we can judge the tested concepts in a fast and easy way.
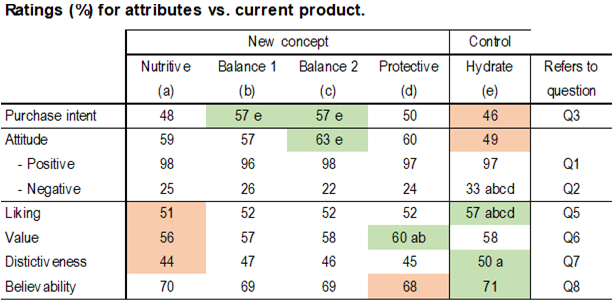
All indexes are comparable by row. The green shadowed values are the best values of the row. Reds are the worst.
All values have been tested for the significance of difference at the 95% confidence level and 5% risk. The current product, for instance, received an Overall Liking value (57) significantly larger than all new concepts (concepts are identified with a letter, letter (a) for instance stands for the new concept “Nutritive”). This means that a “large” number of respondents liked the current product more than the new concepts. Liking alone, however, does not supply enough evidence to determine a winner, especially when the score on Attitude and Purchase Intent are low.
The last column of the table above refers to the question used to derive the index. Each attribute was measured with a single question. Our suggestion is to keep things simple and meaningful. Indexes derived from mixing up the answers to two or more questions tend to increase the difficulty of interpretation and should be used with great caution.
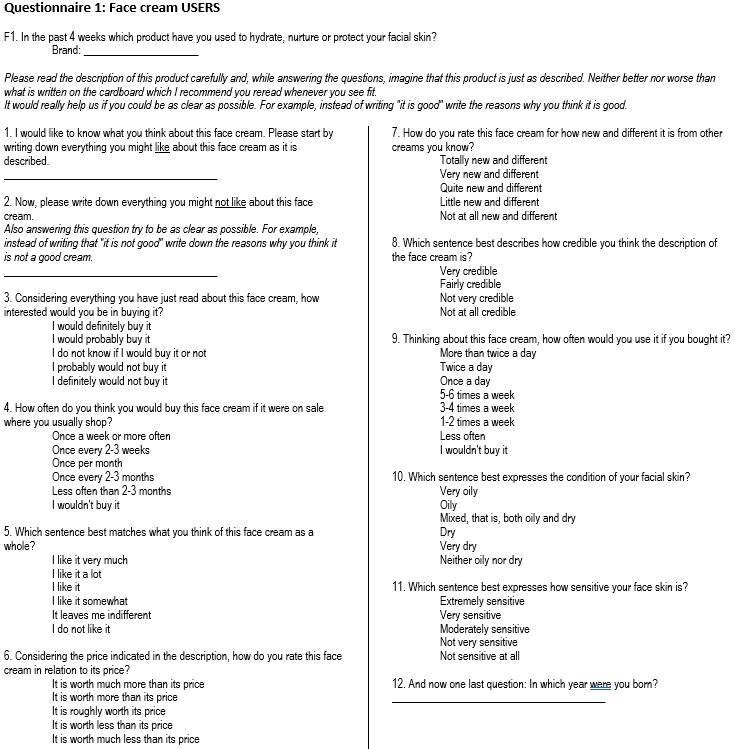
Questions 4 and 9 on usage (see questionnaire below) are not used for indexing purposes. Together with questions 10 and 11 on fix data, they help to draw the user profile, who, for the current product and based on previous studies, tends to be price-sensitive and to not invest much on skin care. These four questions help to confirm we are interviewing an appropriate sample of customers.
Wrapping it all up
Again, be clear on what you want to measure. There is an appropriate research approach for each problem. Mixing up topics outside of the product concept, in this case, may generate monumental questionnaires that can cause the proverbial paralysis from analysis.
Testing a product concept relative to real market conditions is difficult. Mixing up unrelated topics increases this difficulty dramatically.
Therefore, choose the appropriate survey type and keep marketing research questionnaires short and to the point in order to mitigate the risk of gathering unreliable, unactionable survey results.
Try LogRatio’s fully automated solution for the professional analysis of survey data.
In just a few clicks LogRatio transforms raw survey data into all the survey tables and charts you need,
including a verbal interpretation of the survey results.
It is worth giving LogRatio a try!
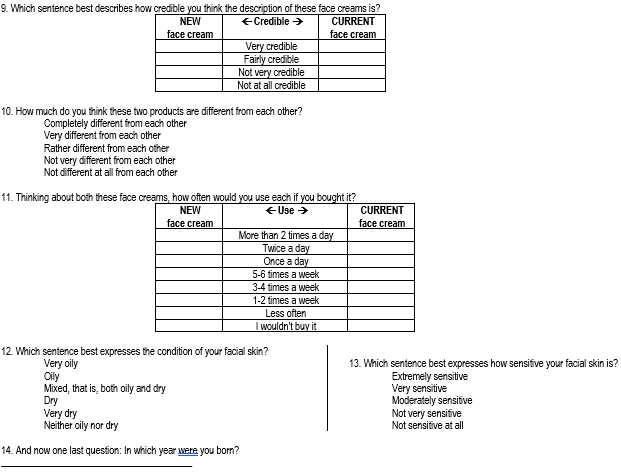
The questionnaire of a Concept test
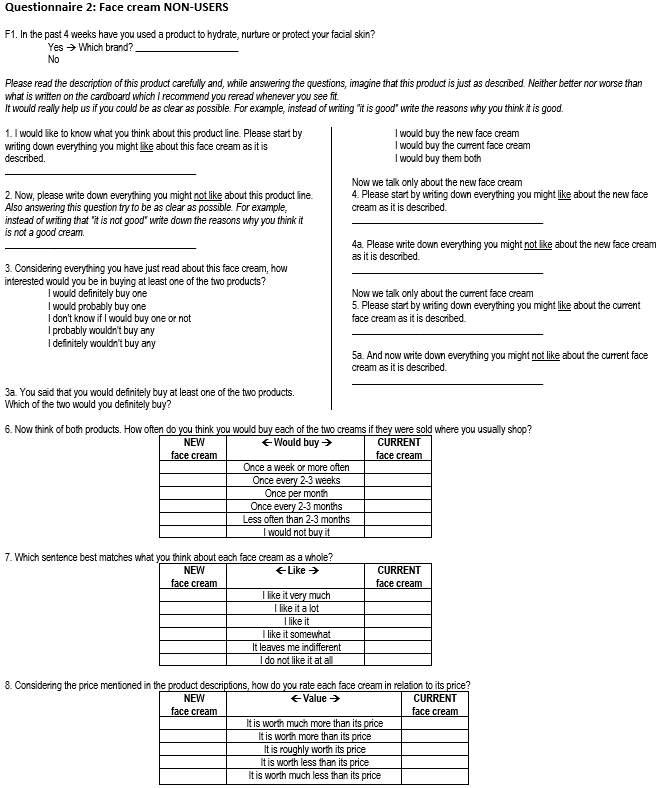
The Concept test of our example used two slightly different versions of the same questionnaire for product category Users and Non-users, respectively.
Sources
Gerald Albaum (1997), The Likert scale revisited. International Journal of Market Research, Vol. 39, No. 2.
Ralph L. Day (1968), Preference Tests and the Management of Product Features. Journal of Marketing, Vol. 32, No. 3.
William L Moore (1982), Concept Testing. Journal of Business Research.
Chunyu Li, Ling Peng, Geng Cui (2017), Picking winners – New product concept testing with item response theory. International Journal of Market Research.

