The A/B test is used to confirm that a given outcome was caused by a certain stimulus.
The A/B test is the modern version of the Split-Run test (SRT), an experimental framework used for over a century.
Originally used to test the performance of two variations of the same advertisement, carefully designed Split-Run tests can confirm causation in more than just advertisements.
It works this way: in order to elicit a reaction, say to visiting our website, two variations of the same message are shown to two groups of people with the same characteristics. The difference in the reaction of the two groups supplies the necessary evidence to confirm, or not, that one ad is more effective than the other in causing the desired outcome.
The confirmation of causality relies on the statistical significance of the difference in performance of the two stimuli.
Caples provides an example of two ads speaking to car owners. The copy of the two ads was identical, except for the headline:

Ad B received 20% more replies than ad A. Now, given all other variables were identical, it must have been the headline that caused the different reaction.
The toughest challenge when testing causation is making sure that all conditions of an experimental setup, except the response variable, are identical. In fact, when this assumption is violated the test results are not valid.
There are two kinds of test validity:
-
- Internal. When the outcome is causal.
- External. When the results of the test can be generalized to different populations.
Try LogRatio’s fully automated solution for the professional analysis of survey data.
In just a few clicks LogRatio transforms raw survey data into all the survey tables and charts you need,
including a verbal interpretation of the survey results.
It is worth giving LogRatio a try!
How to conduct A/B tests
Nowadays plenty of tools are available for conducting Split-Run tests, both online and offline.
Marketing research agencies are the (expensive) professional providers expected to deliver methodologically valid test results.
There is, however, a growing body of DIY-users of field experiments among modern business managers and analysts. In fact, googling “A/B test software list” returns dozens of software applications that claim to collect valid test results in a flexible and cost-effective way.
As we mentioned already, conducting valid Split-Run tests requires holding all conditions constant between the two variations.
From a methodological standpoint this means:
-
- The assignment of the test subjects to either the control group or the treatment group must happen randomly.
- There cannot be audience overlap between the two groups or the test is invalid.
- Unequal demographics between the two groups would return invalid test results.
From the operational side, holding conditions constant for testing two advertisements requires:
-
- To maintain the order of appearance unchanged (during the testing process of the two variations).
- Appear in the same position (on the online page, magazine, etc.).
- Display ads of the same size.
- Test in the same geographic regions.
- Test with the same weather conditions.
- Measure the same reaction, be it click-throughs, purchases, redeemable coupons, or any other relevant measure of success.
As well as to hold constant any other relevant facet of the study. Failing to do so may return invalid test results.
Orazi reports the results of two A/B tests in which one single element varied between the two test objects. These are tests conducted in the form of Randomized Group Design.
There is also a so-called Randomized Block Design (RDB) that divides all experimental subjects into blocks of homogeneous respondents and then randomly assigns them to either the control or one treatment group. In an RBD experimental design several different elements can be tested simultaneously. This is commonly called Multivariate test, as opposed to the A/B test.
How to collect and tabulate the A/B test results
For the purposes of drawing conclusions from an A/B test we need only 2 data for each test variation: the sample size and the number of elicited reactions. These two data allow us to compute the probability (p-value) that there is a significant difference between the effectiveness of the two tested variations. The following table summarizes the process.

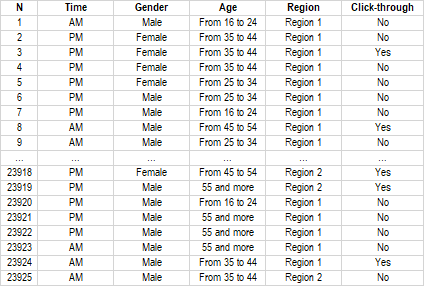
When it is useful to have a more detailed look of the test results, we can store the test data as a database that can be analyzed with LogRatio exactly as we do with a traditional survey project.
When the sample is large enough to create meaningful sub-groups, the significance of the differences can be computed at different levels, and new, valuable information may emerge. For instance, it may reveal different patterns between genders, age groups, the time of day, or other variable that could prove useful during the planning phase of a real communication campaign.

Sources
John Caples (1997) 5th edition, Tested Advertising Methods. Prentice Hall Inc.
Davide C. Orazi, Allen C. Johnston, (2020) Running field experiments using Facebook split test. Journal of Business Research.
Matthew Taylor et al. (2019) Measuring effectiveness: Three grand challenges. Google UK.

