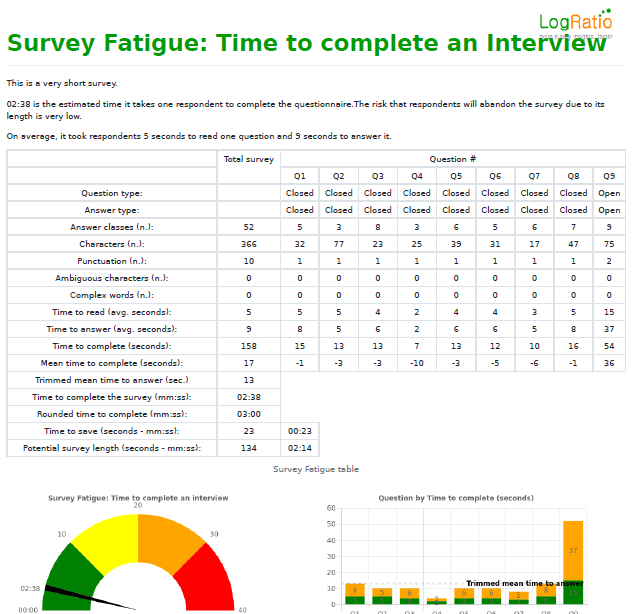
The Survey Fatigue analysis estimates the amount of time required for respondents to complete the survey and makes suggestions on how to reduce it, where possible.
LogRatio reads each question and its answer options. It counts words, characters, and punctuation, and measures text complexity and ambiguity.
Then it estimates the average completion time for a respondent to read and answer the whole survey.
LogRatio transforms this information into recommendations on how to reduce the overall time to complete the survey questionnaire, projects the number of minutes and seconds that could be saved by applying LogRatio recommendations, and highlights questions and answer scales, if any, where saving time is reasonably possible.

Question type (Closed, Open). LogRatio recognizes both closed- and open-ended question types.
Answer type (Single, Multi, Open). LogRatio recognizes two types of closed-ended question: single and multiple answers.
Answer classes. This field counts the number of possible answer classes to each question.
Characters. This field counts the number of characters in each question text.
Punctuation. This field counts the number of punctuation marks in each question.
Ambiguous characters. This field counts the number of characters in each question that may slow down the reading and understanding of the text. Ambiguous characters are, for instance: &, [, {, #, @, and others.
Complex words. This field counts the number of words in each question and answer option that may slow down the understanding of the text. Complex words are, for instance: instead, although, since, unless, whereas, while, and others.
Time to read (average seconds). This is the estimate, in seconds, of the time required to read each question.
Time to answer (average seconds). This is the estimate, in seconds, of the time required to read the answer options of each question.
Time to complete (seconds). This field shows, in seconds, the overall sum of the time required by the average respondent to read and answer each question.
Mean time to complete (seconds). In the first cell of this field, column Total survey, is the estimated average time it takes respondents to answer one question of the survey. The remaining cells show the difference between the time to complete a question and the average time to answer one question. This information allows you to identify questions requiring an above average amount of time to respond, which is a potential source to reduce the respondent fatigue.
Trimmed mean time to answer (seconds). This value is the estimated average time it takes respondents to answer one question computed removing the most extreme values: the longest time and the shortest time to answer.
Time to complete the survey (mm:ss). This is the estimated time, in minutes and seconds, it takes a respondent to complete the survey.
Rounded time to complete (mm:ss). This is the rounded “Time to complete the survey”.
Time to save (seconds and mm:ss). This is the weighted amount of time that could be saved by rephrasing some questions and answers.
Potential survey length (seconds and mm:ss). This is the estimated time the survey could last after rephrasing.
