LogRatio analyzes and interprets survey data saved in a CSV or MS Excel file format.
The number of rows (respondents) and columns (questions) allowed in a survey is unlimited. However, files with many columns of data are not recommended.
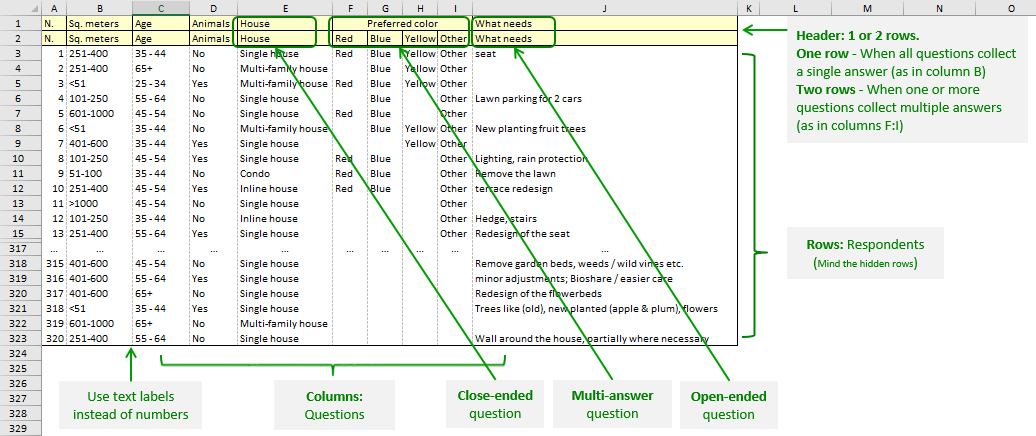
The following image shows how to arrange the input data for LogRatio. Detailed explanations follow.
Requirements
One row of the data table hosts the answers to all questions of a single respondent.
One column of the data table hosts the answers to a single question of all respondents.
LogRatio recognizes three kinds of input data:
- Single-answer, closed-ended questions
- Multiple-answer, closed-ended questions
- Text-answer, open-ended questions
The first row of the table, called table header, hosts the text of each question.
Depending on the kind of closed-ended question, the second row may take two different shapes.
When in a survey there is one or more closed-ended question that allows multiple answers, the header requires a second row, as in the image above. The first row contains the questions while the second row of the table header:
- For open-ended questions and for closed-ended questions with single answer, contains a repetition of the question text, as in the row above it.
- For closed-ended questions with multiple answers, the second row contains the answer options, each one in a single column. In other words, closed-ended questions with multiple answers occupy as many columns as their answer options.
Leave blank cells for missing answers.
Use commas only in open-text answers. Do not use commas in the text labels of answers to closed-ended questions.
Remove columns of continuous and static values. Continuous data could be dates and time, IP address numbers, and the like. Static values could be the account number at an online survey provider, the day of data collection, the answer to a filter question, or other column with the same value in all of its cells.
Suggestions
Your input data to LogRatio can be in any language. However, the PDF report will be produced in English.
Special characters, like ö, ä, ç, ñ, ǽ, etc., could be misinterpreted and reported in a wrong way.
Keeping the text of questions and answers brief results in cleaner, easier to read reports.
In the answer options to closed-ended questions, express numbers in figures rather than words. For instance, write “1 to 5” rather than “One to five”. This helps in sorting them appropriately, which is a useful feature when reading reports. In general, do not use plain numbers, like “1”, “250”, etc.
Make sure the respondent answers are written in a consistent manner. For instance, “I agree” is different from “ I agree” and “I Agree”.
The Data>Filter feature of Excel is an excellent tool to check the consistency of the answer labels to each question.
Grouping data wisely may result in reports that are easier to read and use. For instance, it may help by grouping:
- How to read cross tables