Order brings clarity and helps in understanding things better. LogRatio gives order to your survey data.
Your data is coded appropriately and stored in an Excel sheet ready for additional analysis.
This section of the LogRatio User’s Guide explains only matters related to the user input data. Other topics related to the analysis of survey data and their interpretation are discussed with the explanation of the relevant analysis tool.
There are two sheets in the Excel report of LogRatio: Input Data and Main_DB.
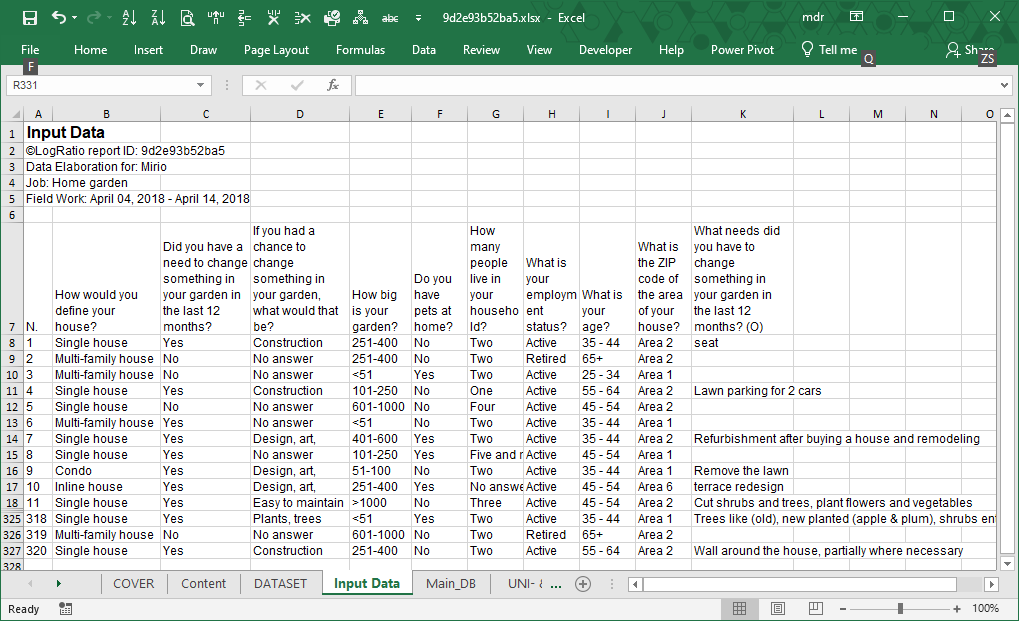
Input Data
This sheet shows the original input data as supplied by the user.
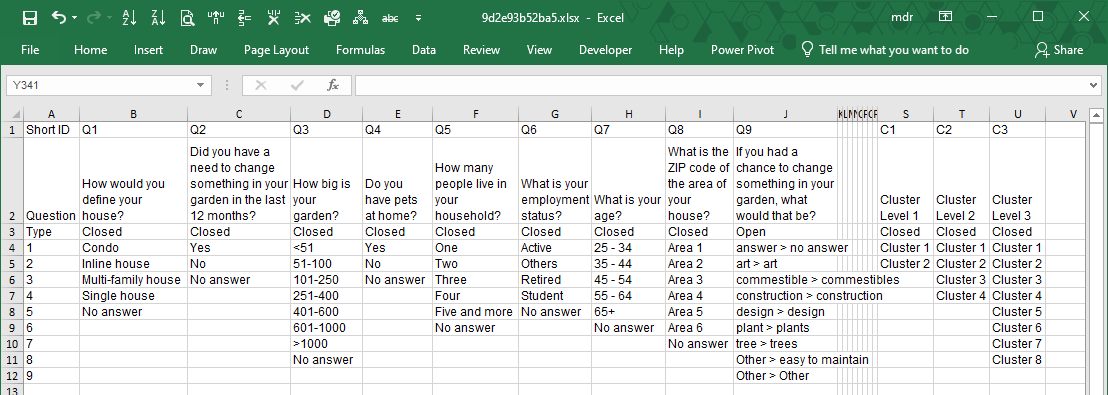
Main_DB
This sheet shows the original input data coded in analysis-ready format. LogRatio’s algorithmic engine uses this dataset.
The frame code, on top of the sheet, shows the question text, the type of question (closed- or open-ended), and the single answer options to each question. The last three columns of the following image are created by the cluster analysis using respondent data by row.
Note: Question “If you had a chance to change something in your garden, what would that be?” is present in sheet “Input Data” but it is not in sheet “Main_DB” because it was not recognized as a closed-ended question due to the commas in the answer labels.
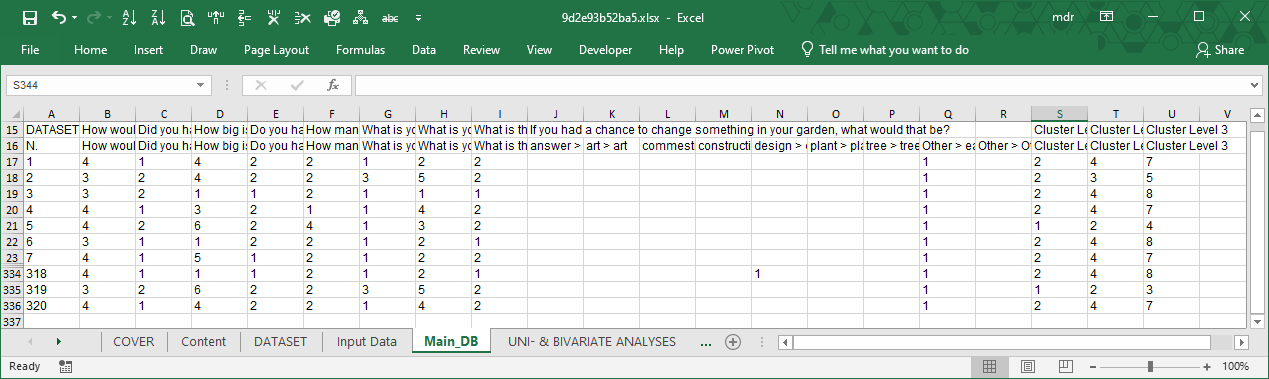
Right under the frame code there is the input dataset in coded format.
The number 4 in cell B17 of the image that follows means “Answer option number 4 to the closed-ended question Q1: How would you define your house?”
From the frame code we see that code 4 to question 1 corresponds to answer “Single house”. Therefore, code 4 means that respondent number 1 answered “Single house” to question: “How would you define your house?”
The data in the original input file needs coding in order to be properly analyzed.
LogRatio does it all for you.
Open-ended questions are also coded, but differently from the closed-ended questions. Open ones first need to be classified.
To classify open text, LogRatio uses different techniques of the Natural Language Processing (NLP). Our solution is not perfect yet. We are still working on it and every significant improvement we make is added to the algorithm. Chances are that at the time you are reading this help material the quality of open-text coding has improved already.
In the image above, columns J:R refer to one single open-ended answer coded in 9 answer classes (see frame code, column J).
The last three columns host the coding results of the cluster analysis.
In column S all respondents are split in two homogeneous clusters, in column T they are split in four clusters, and in column U all respondents are split in eight clusters (see columns S:U of the frame code). The values in these three columns are used to make cross tables useful to identify common tendencies among groups of respondents with similar characteristics. More about clusters in section “Cluster Analyses”.