An old saying goes “You cannot swallow an elephant but you can eat it slice by slice”.
Contingency tables are the tool to slice the market research elephant.
There is a reason why contingency tables, aka cross tables or crosstabs, are perhaps the most used tool by professional survey analysts: Crosstables dig deep into survey data in a systematic way, to turn data into information that can ignite the capacity of generating useful insights.
Try LogRatioSurvey reports as they should be
Cross Tables report organization
In the CROSS TABLES section of the LogRatio Excel report there are as many sheets as questions in the survey.
In each sheet, the main question (dependent variable) is cross-tabulated by all other questions (independent variables) of the survey.
The report sheets are divided into two groups because LogRatio makes a distinction between closed- and open-ended questions:
- CrossTab – Closed-ended – Q[number]. In each of these sheets, the dependent question is a closed-ended question cross-tabulated by all other closed-ended questions of the survey
- CrossTab – Open-Ended – Q[number]. In each of these sheets, the dependent question is an open-ended question cross-tabulated by all other closed-ended questions of the survey (as of January 2020, LogRatio does not treat open questions. The functionality will be restored as soon as possible).
In each sheet, each pair of crossed questions produces two tables (as in the following image, where “Do you have pets at home?” is the dependent variable):
- Cross Table A, on the left, shows percentages (aka proportions) by column. The sum of the percentages of a column adds to 100%.
- Cross Table B, on the right, shows percentages by row. The sum of the percentages of a row adds to 100%.
Although the counts do not change, the two tables supply different percentage values, different significance test results, and different error levels. The same picture, taken from two different perspectives, supplying different information, gives the opportunity for expert analysts to uncover hidden relationships not always apparent using only one of the two tables.
Using cross tables correctly, however, requires experience, and there are some topics to pay attention to.
Continue reading this help chapter to learn how to read and use survey reports created with LogRatio.
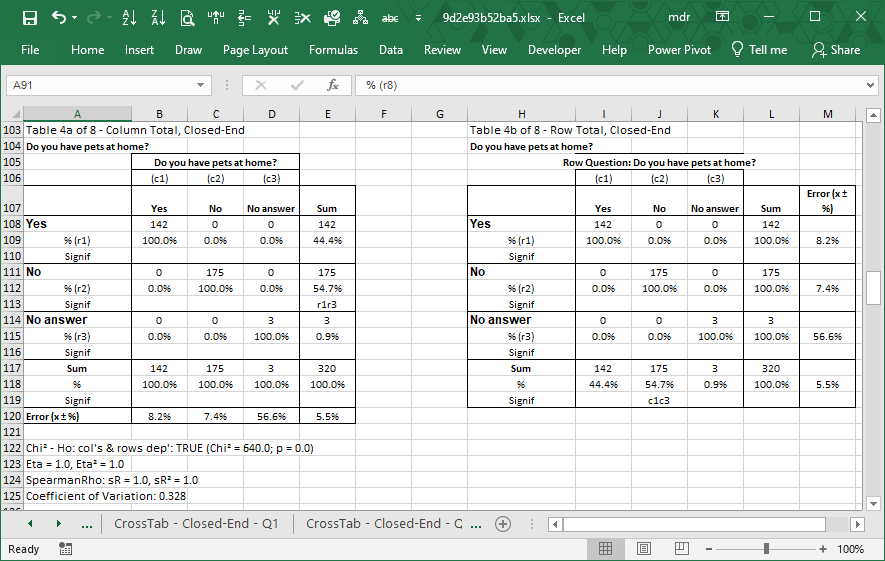
Image 1: LogRatio crosstable A and B