LogRatio’s Morphologic analysis aims to identify, in a very concise manner, closed-ended survey questions with an atypical distribution of the respondent answers across classes.
The Morphologic Grid is the tool that points the user directly to those questions that might suffer from an inappropriate answer scale, due to a high or low concentration of respondent answers on a few or many classes, respectively.
Each question is plotted on the grid according to Skewness and Kurtosis as they are reported in the table of sheet Descriptive Statistics.
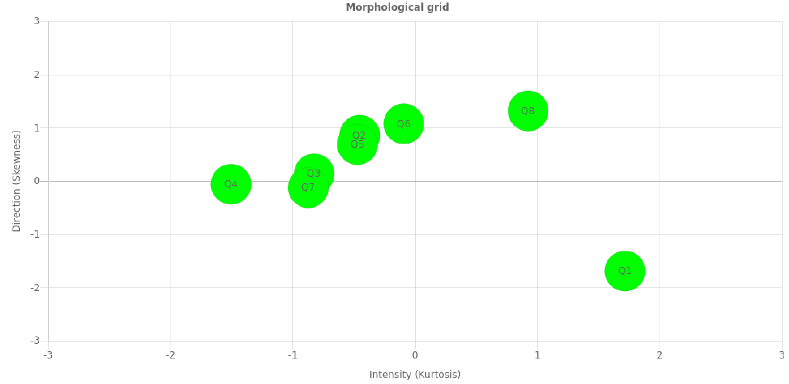
Skewness measures symmetry. Consider, for instance, the Likert’s scale “Very fun, Fun, Neither … nor, Boring, Very boring”. Negative skewness is calculated when responses tend towards “Boring” answers. Positive skewness is returned when responses are more frequently “Fun” answers.
Kurtosis measures frequency. Large kurtosis values are from questions with one or more answer classes peaking while collecting fewer answers for extreme codes, both large and small. Small kurtosis values indicate a flat distribution of answers (no peaks) while more answers are assigned to extreme codes, both large and small.
The bubble size represents the number of answer classes of one question.
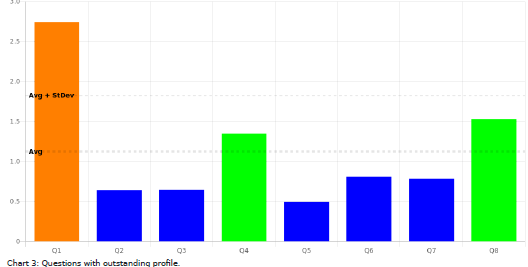
Those bubbles lying at the edges of the grid suggest to verify that the answer scale collects data appropriately. In our example, bubbles Q4, Q8 and Q1 lie at the edges of the map, and the following bar chart confirms it.
The bar chart plots on the vertical axis the distance from the centroid of skewness or kurtosis of each question. Values above average are suspect. Values above one standard deviation show evidence of an atypical distribution of the respondent answers across classes.
Read these charts together with the box-plots(helicopter view) and histograms (periscopic view) in the Excel report accompanying this PDF file.
The data does not confirm your hypotheses? There are still options to extract valuable information from your survey data. You can:
- Recode the answers to single questions, for instance, increasing or reducing the number of answer classes
- Merge two or more variables together, to form new, potentially useful variables (for instance, rounding with zero decimals the Geometric Mean of two or more answer codes from the same respondent to different questions)
- Remove one or more irrelevant variables from the analysis