Centroid
The centroid corresponds to the group mean of a cluster. The items clustered in a group are said to be homogeneous because their distance from the centroid is minimized with respect to the other groups found with the same cluster analysis.
Marketers are interested in dividing customers into homogeneous groups because it is easier to reach and communicate with a group of people sharing some fundamental characteristics.
Cluster
A cluster is a homogeneous group of items from the same set that are well separated from other groups. There is a considerable number of different approaches to clustering data. Myers distinguishes between two basic conceptual frameworks for segmentation:
- Customer-based versus Product/Service-based segmentation. These are dependence techniques, which use one or more independent variables to explain and predict a dependent variable. Among the most common dependence techniques are AID, CHAID, regression, and discriminant analysis.
- A priori versus Post hoc (a posteriori) segmentation. These are independence techniques, which are typically used for grouping people or items similar in terms of one or more describing variables. Among the most common independence techniques are hierarchical clustering, partition clustering, and other multivariate analysis methods such as factor analysis, correspondence analysis, and principal components analysis.
LogRatio applies the Ward’s clustering algorithm, a hierarchical methodology that has the advantage of not requiring the analyst to decide in advance how many clusters to find in the data and, therefore, can be completely automated, which is aligned with the mission LogRatio is on: Simplify.
Dendrogram
Dendrograms are tree-like structures LogRatio uses to visualize when and how the various pairs of items of a survey have merged during a cluster analysis. The horizontal axis refers to the Euclidean distance when two items merged. The shorter this distance, the more similar the two items.
Error level
See section Sample Size Analysis.
Euclidean distance
To find homogeneous groups in a dataset, LogRatio applies the furthest neighbor, squared Euclidean distance method, perhaps the most commonly used distance measure. The formula is:
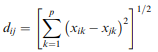
The Euclidean distance can be interpreted as physical distance between two items.
Hierarchical methods
See Cluster.
Homogeneous groups
See Cluster.
Level histogram
The Level histogram, aka scree-plot, helps in determining the number of segments of a cluster analysis. It is a plot of the within-cluster heterogeneity on the vertical axis and the number of segments on the horizontal axis. Hierarchical cluster analysis groups respondents together until only one cluster is left, the last bar on the right side of the histogram.
There is no formal rule for interpreting this chart. Starting from the right, it is typical to take the number of clusters that have a sharper cut from the remainder, excluding the last, largest group, which groups together all items.
Proportions
Proportions, aka percentages, are labeled with “%” in the cross tables made by LogRatio. There are two kinds: row percentage and column percentage tables, shown as cross table A (left side of the sheet) and cross table B (right side), respectively. Percentages are obtained by dividing the counts by the Sum of counts of a table. The sum of percentages of one direction, A or B, adds to 100%.
Proportions can be interpreted as probabilities.
Standardization
This means preliminary processing data so that each column vector (like all respondent answers to one closed-ended question) has a mean value equal to zero and a standard deviation equal to one. This way, any effect due to the size of one variable against another is removed and the clustering algorithm returns more reliable classifications.
The complete standardization of the single values of a vector is obtained with the formula:
![]()
Ward’s algorithm
Ward’s is a hierarchical partitioning method that applies a recursive algorithm to minimize the total within-cluster variance and find the pair of items that, after merging, leads to a minimum increase in total within-cluster variance.
The Ward’s clustering method is particularly effective in the case of automated analysis because it does not require specifying in advance the desired number of clusters to be found in the data.