The first 7 rows of this sheet summarize the values provided initially by the user on the LogRatio website.
The “Error level” in B5 was computed by LogRatio based on the number of interviews. This is an important value.
The colored table below shows viable sample sizes according to varying values of Confidence and Error (with random respondent recruitment).
The greener the cell, the smaller the error and the more reliable the results gathered with that sample size. The more red, the larger the error, and the less reliable the survey results.
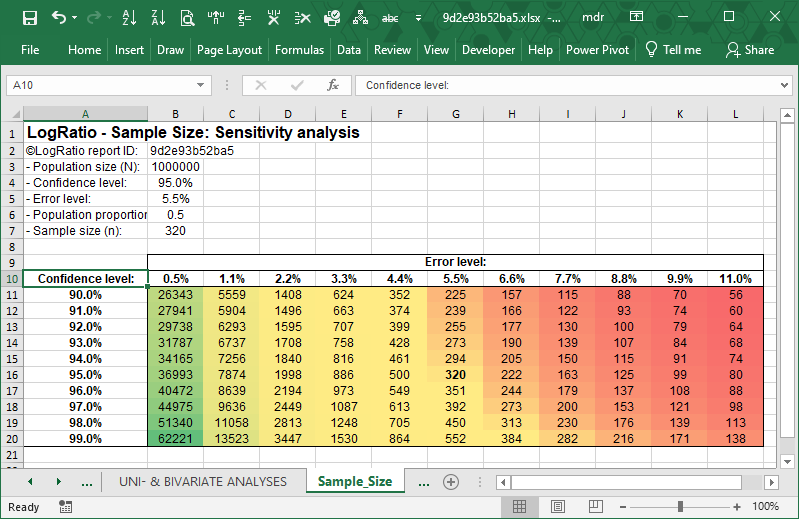
Note: Both samples of 56 or 62221 can be representative of the population they are extracted from. In fact, it is not the sample size that determines the representativity of the sample. It is the way respondents are recruited that matters in order to extract a sample that reproduces the characteristics of the whole population. LogRatio assumes respondents were chosen randomly.