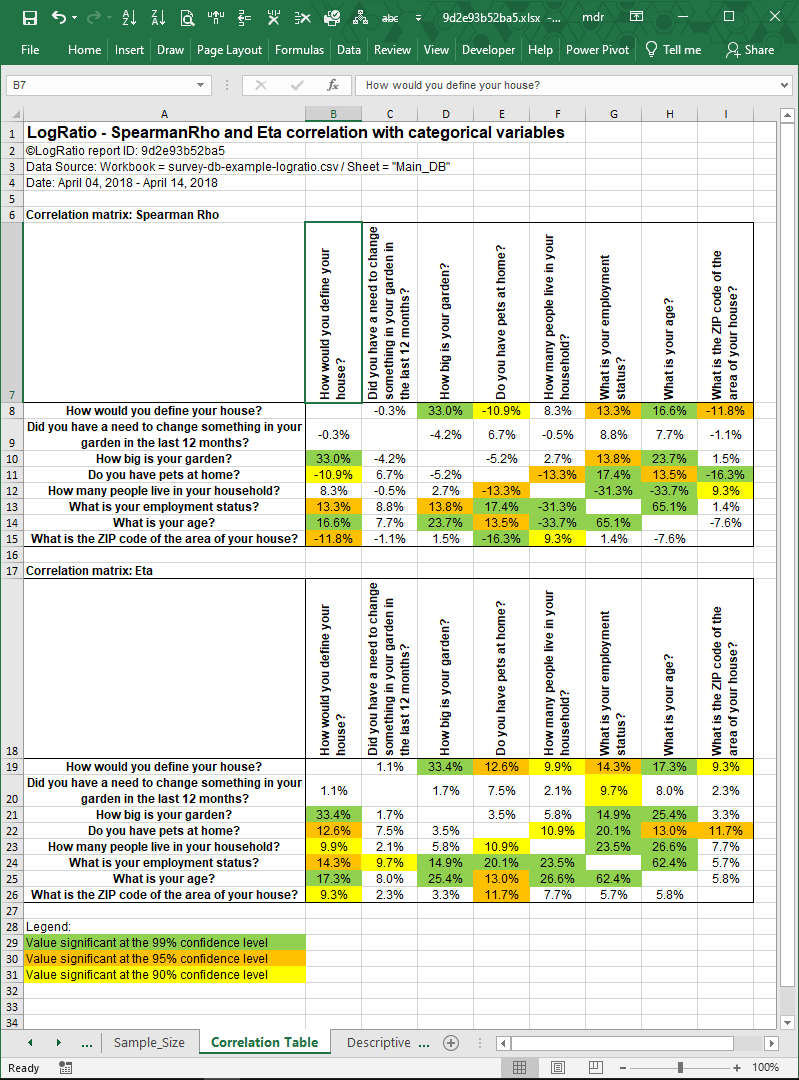
This sheet hosts two correlation tables: The values of the first table are computed as Spearman Rho correlation coefficients; in the second table are the Eta correlation coefficients.
Rho coefficient measures the strength and direction of association between two ranked variables. It ranges ±100%, where negative values show an increasing negative correlation and positive values show an increasing positive one.
Eta coefficient measures a relationship, both linear and non-linear. It can never be negative, and it can be interpreted similarly to the Pearson correlation coefficient.
Non-white cells indicate significant coefficients at different significance levels: Green = 99%, Orange = 95%, Yellow = 90%. A significant coefficient means that what we are measuring with a sample can be assumed to be true also in the population the sample comes from, at different levels of reliability.