Correlation analysis studies the relationship between two variables. For instance:
- Negative correlation (as one variable increases, the other decreases). For instance, as the number of hunters in a region increases, the deer population of that region decreases.
- Positive correlation (the two variables increase or decrease together). For instance, as the level of perceived cleanliness in a restaurant increases the satisfaction of customers increases too.
Understanding the strength of the relationship between variables helps in avoiding redundant analyses and finding sometimes useful constructs, like those concerning emotions and believes. The strength of a relationship is measured by the correlation coefficient.
It must be remembered that correlation does not mean causation. Just because two variables are correlated it does not mean one causes the other. Once you are aware of this, correlation analysis is definitely a useful technique for decision-makers.
Different kinds of correlation coefficient have been developed over time, in order to account for the different ways variables are measured. Pearson product moment correlation coefficient is perhaps the most popular one (also available in MS Excel as the CORREL function).
LogRatio uses two particular correlation coefficients to measure the relationship between categorical variables like those of respondent answers to survey questions: Spearman’s Rho and Eta.
LogRatio creates two correlation matrixes with the closed-ended questions of the survey: one with Rho and one with Eta coefficients. The relevant bi-variate relationships in these matrixes are commented and, more importantly, they are used to identify any existing sub-models in the data. Sub-models are groups of strongly related variables that may refer to the same unmeasured concept (also called construct or latent variable).
The sub-models LogRatio searches for aim to identify latent aspects (not measured with the survey) of the respondents’ behavior, beliefs, attitude, or other characteristic of potential interest to the analyst.
For instance: The management of a fast-food restaurant could be interested in the construct “Customer satisfaction” measured through the variables “Cleanliness, Quality of food, and Parking lots”. Such a model could show how its elements interact and how each element contributes to the overall satisfaction of customers. This information may help in allocating resources wisely, setting priorities, defining key performance indicators, and more.
The correlation analysis written report covers two topics: Reliability analysis and Pattern detection.
Try LogRatioFully automated survey reports
Reliability analysis
In this section LogRatio performs two operations:
- 1. It tests whether there are any non-linear correlations between variables, in which case it interprets the Eta coefficients. Otherwise, it interprets the Rho coefficients.
- 2. It uses the selected correlation coefficients to identify those pairs of variables with the largest and the smallest coefficients, because these variables show the strongest relationship and may suggest useful information to expert analysts.
Strong, meaningful relationships are seldom found. The challenge is to assess whether the association exists, how strong it is, and find practical applications for the new finding. Read the correlation matrix together with the values in sheet “Descriptive Statistics” of this report.
Caveat: LogRatio removes missing values pairwise. For instance, for any two variables, LogRatio computes the correlation coefficient only if a respondent answered both questions. Otherwise, both values for that respondent are removed.
Pattern detection
This section of the report checks whether the survey data contains one or more sub-models that could explain some latent aspects of the respondents’ behavior, beliefs, attitude, etc.
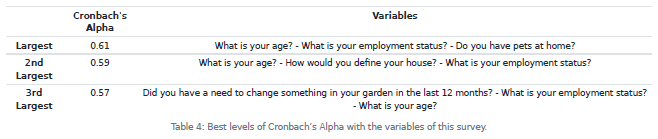
LogRatio inspects all permutations of three or more closed-ended questions (variables), hence a model or sub-model. It uses the Cronbach’s Alpha coefficient to assess if the variables in a model measure the same concept.