Sheets: CrossTab – Closed-Ended – Q[n]
Each of these sheets in the Excel report, 8 in our example, contains one dependent variable (columns of tables) cross-tabulated by all other closed-ended questions of a survey (independent variables, rows of a table).
This fine view enables us to uncover useful details that are not always apparent at first sight.
Read also How to read cross tables to learn more about cross-tables produced by LogRatio.
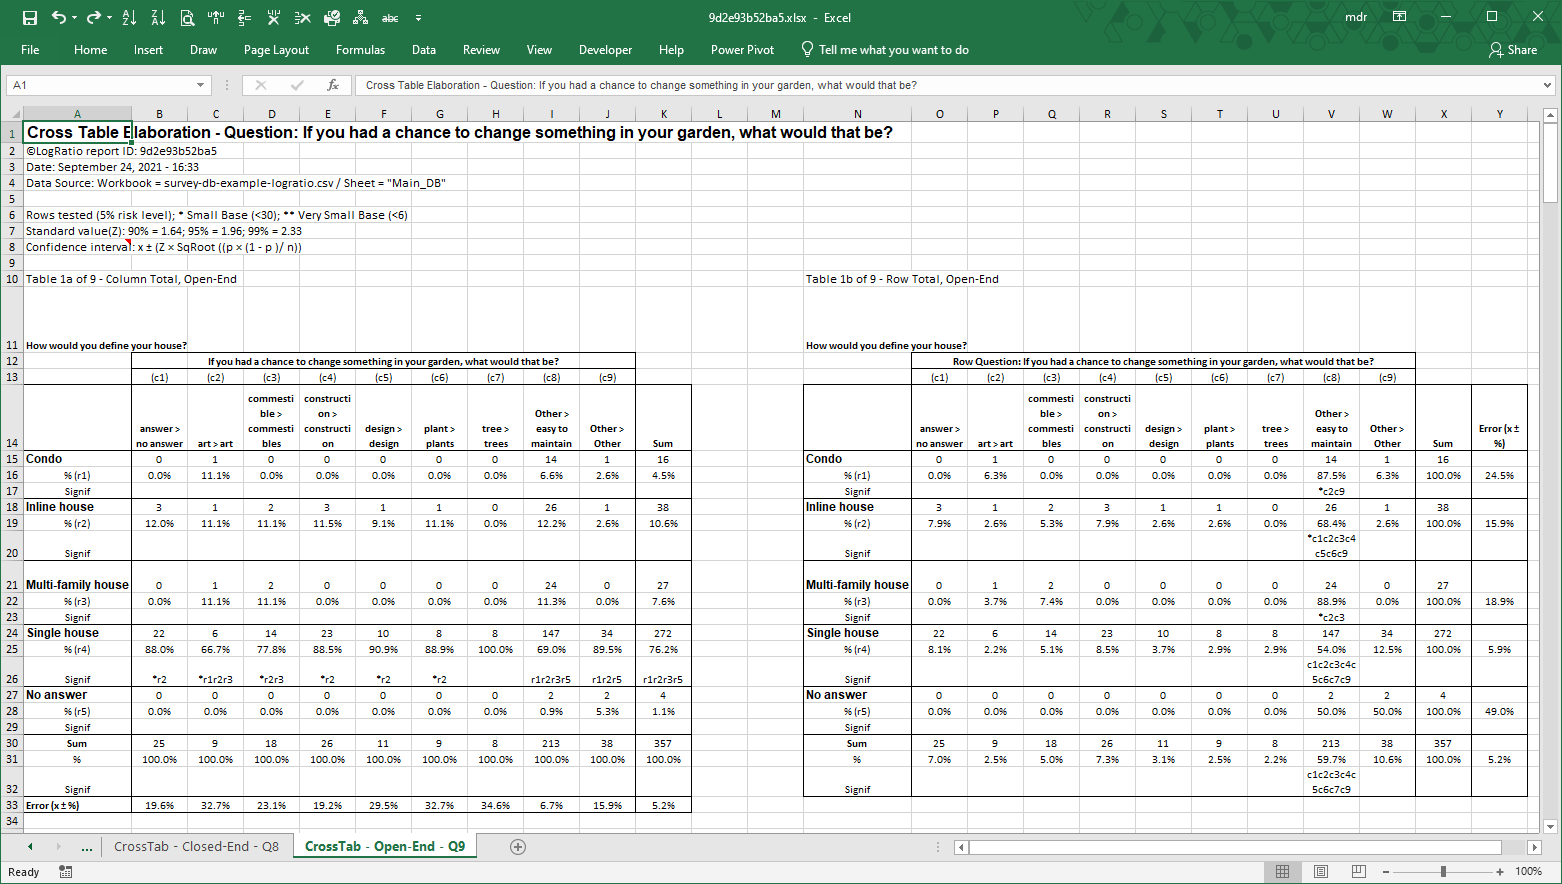
Sheet: CrossTab – Open-Ended – Q[n]
LogRatio transforms open-text answers into numerical codes, and the codes into cross tables, as in the image that follows. The transformation from text to numbers requires the application of advanced algorithms of Deep Learning and of Natural Language Processing (NLP).
As of January 2020, LogRatio does not treat open questions. The functionality will be restored soon. Our solution to the automated coding of text is not perfect yet. We are still working on it and every significant improvement we make is added to the algorithm. Chances are that at the time you are reading this help material the quality of open-text coding has improved already.
Read also How to read cross tables to learn more about cross-tables produced by LogRatio.