The Descriptive Statistics section of LogRatio’s report provides several measures that describe the data gathered with the single questions (variables) of a survey.
LogRatio applies Exploratory Data Analysis (EDA) techniques to explore survey data while searching for over- and under-representations, outliers, anomalies, and more.
LogRatio reads the results of the EDA analysis, suggests how to interpret the survey results, and makes suggestions for improving results, in case the survey will be repeated.
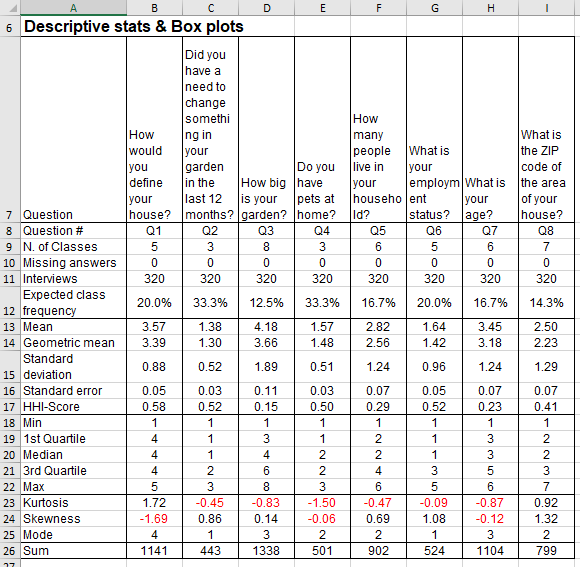
Read section Excel Sheet: Descriptive Statistics for a description of the rows of the image that follows.
Among others, the information in the Descriptive Statistics section of a survey report is useful for:
- Understanding better the respondent answers
- Identifying variables with unusual shape
- Feeding models, like Monte Carlo simulation
- Projecting results to the population level the data comes from
There are five analysis areas in this report: