Categorical variables
Categorical variables are measured with answer scales consisting of a set of categories.
There are different types of scales. LogRatio recognizes the following three types:
- a. Nominal. The categories of these scales do not have a natural order. For example, travelling by: car, bike, bus, run.>
- b. Ordinal. The categories of these scales do have an order (although the distance between categories is unknown). For instance, likelihood to do something: Very likely, likely, … , completely unlikely.
- c. Interval. These variables have answer scales with an order and the distance between answer classes is measurable. For example, age or annual income.
Closed-ended questions
The form of a question may be either closed (i.e., of the type ‘yes’ or ‘no’) or open (i.e., eliciting free response). Closed questions may require respondents to select a single or a multiple answer. Questions that are open-ended ask respondents to supply the answer in their own words.
Coefficient of determination (R2)
This corresponds to the Correlation coefficient squared. It ranges from zero to one, where:
- A correlation squared equal to 1 means there is a perfect fit. The independent variable models very accurately the dependent variable. Therefore, this model is highly reliable.
- A correlation squared equal to 0 means there is a perfect unfit. The independent variable cannot model at all the dependent variable. Therefore, this model is highly unreliable.
- As squared correlation equal to 0.5 means the independent variable predicts 50% of the variation in the dependent variable. This is often regarded as a satisfactory correlation level for analytical purposes.
Correlation coefficient (R)
The correlation between two variables measures the strength of their relationship.
- A correlation near +1 means that there is a strong positive relationship between the variables. That is, when x is large, y tends to be large, and when x is small, y tends to be small too.
- A correlation near –1 means there is a strong negative association between the variables. That is, when x is large, y tends to be small, and the other way around.
- A correlation around zero indicates a weak association.
Correlation matrix
The correlation between more than two variables may be represented in the form of correlation matrix, which is a preliminary analysis useful for uncovering meaning hidden in the survey data.
Correlation analysis is particularly useful when seeking broad patterns in the data. In the pattern detection section, LogRatio reports on the existence of sub-models in the data that could explain latent aspects of the respondents’ behavior, beliefs, attitudes, etc.
When there are key variables in a survey (like satisfaction, interest, willingness to recommend, etc.), looking at their correlations with all other variables may reveal interesting relationships that could lead to reasonable hypotheses regarding the relationships between these variables.
Error level
When interpreting the results of a survey, the researcher has a large number of tables of frequencies and percentages to examine. These results, being based on a sample, will be subject to sampling errors. The error levels LogRatio computes measure exactly these errors for a whole table as well as for the single columns and rows.
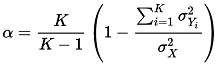
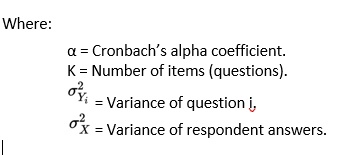
Cronbach’s alpha
LogRatio uses Cronbach’s alpha to measure the reliability of a model made of variables measured with a survey.
Alpha estimates internal consistency, or the degree to which a set of items measures a latent construct. For instance, to measure the attitude towards our brand we may ask respondents to answer three questions with a 5-point Likert’s scale: Overall brand appeal, Price value, and Willingness to recommend. Cronbach’s alpha measures the likelihood that our three questions measure the latent construct “attitude” for our brand. That is, there is internal consistency in the three variables, they are on topic.
Cronbach’s alpha ranges between -1 and 1, although negative numbers arise only occasionally.
Alpha equal to 0.6 is a sort of practical threshold to separate consistency from inconsistency.
Alpha larger than 0.9 may indicate some redundancy in the model, that is, the contribution of one or more variables overlaps with other variables of the model and therefore there may be room to simplify the model by removing variables with a low contribution to the model.
Eta correlation coefficient (η)
Eta measures the correlation between variables, whether it is linear or not. Eta is ideal for categorical variables, like those used to gather the answers to survey questions. It can never be negative, and it is interpreted similarly to the Pearson’s correlation coefficient.
In general, the larger the value of Eta, the stronger the relationship.
Latent variable
There are two major types of variables: observed variables and latent variables.
Latent variables (constructs or factors) are variables that are not directly observable or measured. They are measured indirectly from a set of variables measured, in our case, with surveys.
For example, attitude, satisfaction, or preference can be modeled in the form of latent variables, whose value is measured through the answers to other questions. For instance, Purchase intention could be the latent variable of a model made of questions aimed at gathering judgements concerning: Product likeability, Price-value, and Brand credibility.
Non-linear correlations
Measuring correlation between two variables differs depending on whether the variables are related linearly or nonlinearly.
A typical example of linear correlation is Ice cream consumption and Air temperature. Sales of ice cream grow linearly in summer. On the other hand, a nonlinear relationship is that of Sugar quantity and Soda preference. Up to a certain point, more sugar makes the soda taste good, beyond that point, adding more sugar makes the soda taste worse.
Measuring a nonlinear relationship requires an appropriate correlation coefficient. LogRatio uses the Eta coefficient, which also has the advantage of being suited to test categorical variables. The popular Pearson’s coefficient of correlation (see function CORREL in Excel) measures correlation in linear relationships of continuous variables and cannot deliver satisfactory results with the categorical data of survey questions.
Pearson’s correlation coefficient
Karl Pearson’s coefficient of correlation (or simple correlation) is a widely used method of measuring the relationship between two variables. It assumes, among other things, that there is a linear relationship between the two variables. Therefore, it is not the ideal measure when dealing with categorical variables like those of a survey.
This coefficient measures the strength and direction of the linear relationship between two continuous variables, and it can range from -1 to +1.
In general, the larger the absolute value of the correlation coefficient the stronger the relationship. The sign of the coefficient refers to the direction of the relationship.
Rho correlation coefficient (ρ)
The Spearman Rho correlation coefficient, aka Spearman’s rank correlation coefficient, was developed to measure the correlation, whether linear or not, of data not expressed as an interval or ratio measurement. The categorical codes used to measure survey answers are most often of this kind.
Spearman’s Rho ranges between +1 and -1, and can be interpreted like the Pearson’s correlation coefficient.
Significance levels
Significance levels tell the researcher the likelihood that a value is the mere result of chance. Generally, researchers use the 0.95 (or 95%) confidence level to denote that a result is reliable.
Significance test
When survey data shows that 65% of respondents answered Yes to a certain question and 23% answered No, there is little doubt that a strong difference between the two groups of respondents exists.
But what about when 46% versus 51% answered Yes and No, respectively? Can we still say the data do not differ by chance?
In order to answer this question, LogRatio employs the Z-test for testing the significance of difference between two proportions. For instance, “r1” in cell C113 of the following table means that the value 59.5% is statistically larger than 40.5% (r1) in cell C109. That is, with 95% probability the difference is not due to random variation.
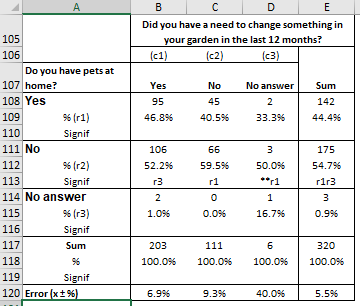
Testing significance may prove very useful when screening large amounts of contingency tables of a survey. Significance values help in quickly locating those data that drive the most substantial differences in the tables.
Spearman’s Rho
Spearman’s Rho is a popular correlation coefficient, appropriate to measure the correlation of both continuous and categorical variables. Spearman’s Rho varies between -1 (perfect negative correlation) and 1 (Perfect correlation). Most of the rules applied to interpret the Pearson correlation coefficient apply to Spearman’s Rho as well. One peculiarity of Rho is that it assumes a monotonic relationship in the data, that is, high scores in one variable are related to high scores in the second variable and vice versa.