Sampling is like cooking spaghetti. You try one strand to see if they are all cooked. In doing so, you run the risk of saying the pasta is cooked when it is not.
Making a mistake when cooking at home may be disappointing, but how much more risk are you taking when making decisions with an online sample survey?
The Sample Size analysis report of LogRatio tells you exactly this: The amount of risk your sample carries.
A clear and detailed understanding of the sample you are using is important to:
- Contain the cost of the research
- Interpret data correctly
- Reference the study correctly
- Support decisions with fact rather than gut feeling
Understanding your sample is the first step into the world of scientific decision-making.
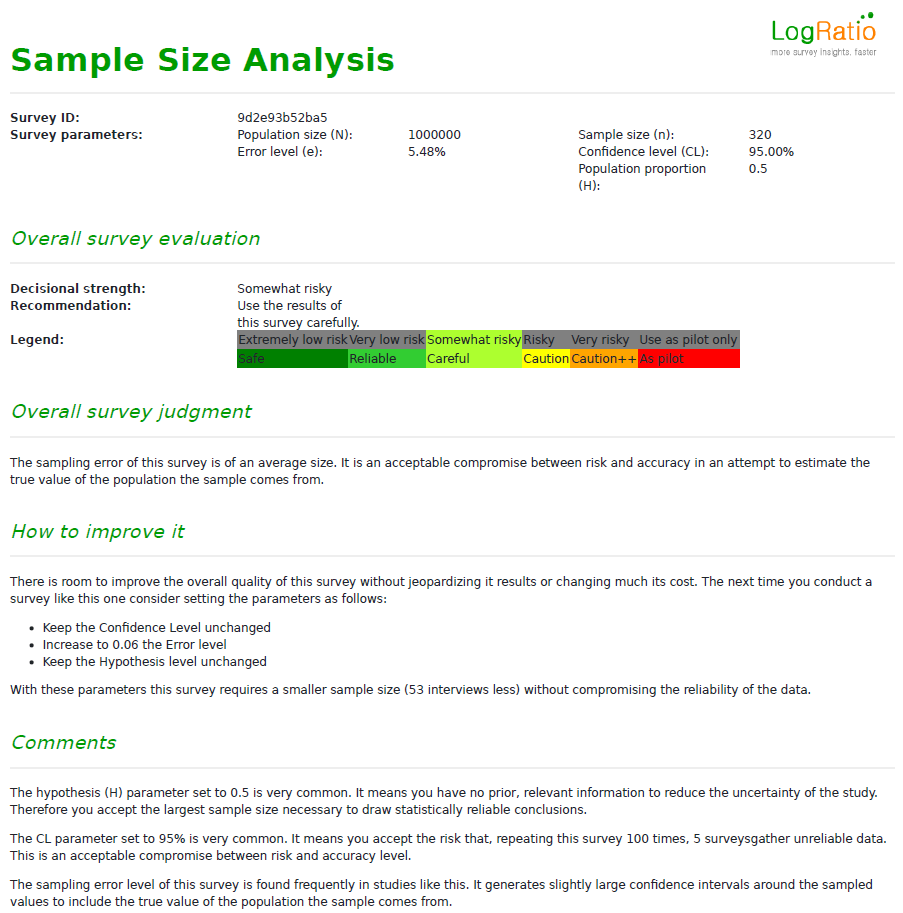
In order to judge the survey as a whole and to suggest how to improve it, in case it is repeated, LogRatio evaluates several parameters supplied by the user and computes the overall error level of the survey, as well as other measures.
LogRatio judges surveys according to 6 risk levels that decision-makers may incur when basing decisions on the information coming from a sampling research:
- Very low risk
- Low risk
- Somewhat risky
- Risky
- Very risky
- Use as pilot only
In general, the larger the error the riskier the results of the survey.
The lowest level of reliability suggests using the survey “As a pilot study only”. This means the results of the survey should be used only to refine the survey and repeat it in order to collect more reliable data. Other decisions should not be supported with such a risky sample.
How to use the Sample Size report
The Sample Size report shows how many cases (interviews) are necessary to estimate values consistent with the real values of the population the sample comes from. This consistency, or accuracy, can be set at different levels according to the Confidence and Error levels of the survey.
The Confidence Level
For a number of reasons, a sample can deliver wrong data. The confidence level of the survey accounts for this eventuality.
The typical confidence level of surveys used for business purposes is 95%, although 90% and 99% are also common levels. Setting the CL at 95% means in 5 cases out of 100 we accept the risk of extracting a sample that does not reproduce correctly the characteristics of the population it comes from.
Say we extract 100 samples from the same population. 5 samples deliver results that do not reproduce correctly the values we were interested in while 95 samples estimate correct data.
Is 95% an acceptable Confidence Level?
It depends on the decision we have to make. To forecast the winner of a political election presumably not1 while to estimate user preference between Product A and B the 95% could be an acceptable confidence level to generate useful survey data.
The Error Level
Intuitively, values estimated with sample surveys imply uncertainty. The Error Level (EL) of the survey measures this uncertainty. For the sake of sampling there are two relevant kinds of error:
- Pre-survey. The error level used to determine the size of the sample.
- Post-survey2. The exact error level we can compute only when the survey is complete.
A typical error level of business surveys is 5%, but it may vary remarkably.
Note: Beware of marketing research agency consultants defining the size of the sample based on your budget. You run a serious risk of wasting money. Plan your survey according to your need and then, eventually, find the statistical justification to any compromises you make to satisfy your budget constraints. For instance, you want to estimate a value in a tight interval but do not have the budget, you may either accept different confidence and error levels or you can lower the hypothesis of the study. More on this later in this document.
Setting the pre-survey error level to 5% we are implicitly stating we want to estimate values in the confidence interval (5%), were is the value to be estimated. For instance, we estimate the market share of Brand A (A) to be 19% with 5% error level. This value should be actually read as any value in the range 19%5%3 or any value in the range 14% – 24%.
Why is this important?
Because it answers a crucial question. Say we measure the daily time spent online by teenagers and we find girls spend on average 203 minutes and boys 232 minutes a day online.
Can we state Boys spend more time online than Girls?
Well, it depends on the error level.
At the 95% confidence level, a sample of 50 respondents, say girls, with an average of 209 minutes 36.74 minutes spent online a day estimates the average time in the interval 199-219 minutes. For 50 boys reporting on average 23256.4 minutes online the interval is 216-2485.
Now, given the two intervals overlap a rule of thumb suggests we cannot say boys spend more time online than girls6. This concept goes under the name Significance Test and is illustrated in the next image. But, no worries. LogRatio does it all for you and explains it all in plain English.
Overlapping intervals are not significantly different.
Testing the significance of survey proportions (aka percentages) is important to avoid the risk of placing too much emphasis on values which in fact are not significantly different from comparable values. This in turn helps in avoiding wrong decisions.
Done by hand, testing values for significance is a tedious and time-consuming statistical exercise. We are lucky enough to have LogRatio do it all, fast.
Hypothesis of the study
This value can help you save money.
Most surveys set the Hypothesis of the study to 0.5, which means we do not have any prior knowledge of the subject of the survey that can help us reduce the size of the sample.
For instance, say we want to estimate the market share of our brand. Sometime earlier we had already conducted a comparable study which measured 35% of respondents preferred our brand. For this new study we can therefore set the hypothesis of the survey to 0.35, and the size of sample will shrink. The sample of a study at the 95% confidence, 5% error, and hypothesis equal 0.5 requires 384 cases. Reducing the hypothesis to 0.35 the sample size requires 32 interviews less, or 349 cases.
1Read the article “Brexit: Why Projections Were Wrong“ on how to interpret survey data: https://www.marketingstat.com/market-research-projections-brexit/.
2Computing the post-survey error level is important when the gathered sample size differs from the planned one.
3The confidence interval around a proportion is built with the formula: ![]()
4This is the standard deviation in minutes of all answers.
5The confidence interval around a mean (aka average) is built with the formula: ![]()
6To be able to do so we need a lower error level, which in turn increases the size of the sample.
Understanding how to set the hypothesis of a survey is important. You can save money and time; you use prior knowledge in a more economical way; and you act as a data scientist would.